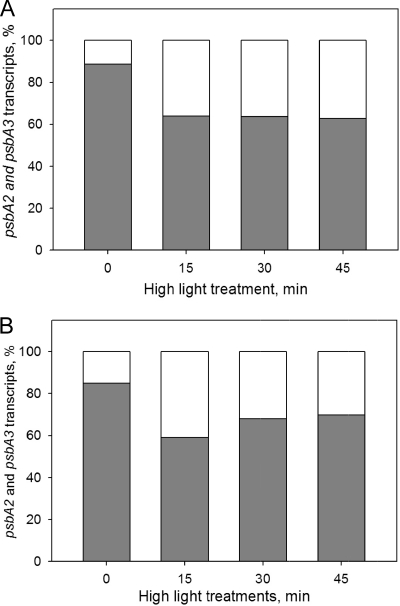
FIG. 9.
Distribution of transcripts from the psbA2 and psbA3 genes after high-light treatment. The percent fractions of the psbA2 (gray) and psbA3 (white) transcripts in the control (A) and ΔsigBD (B) strains were calculated from the data presented in Fig. 8.

