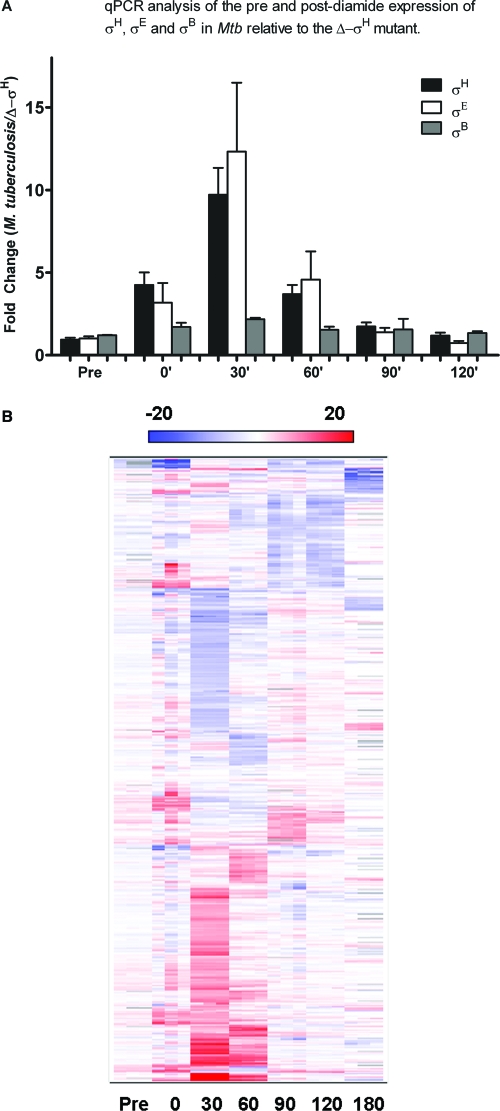
FIG. 2.
Analysis of the comparative transcriptome levels of wild-type M. tuberculosis and the Δ-σH mutant PDS. (A) The expression levels of σH, σE, and σB in wild-type M. tuberculosis relative to the levels for the Δ-σH mutant in PDS samples were assessed by qPCR at different time points. Values represent mean differences (n-fold) ± standard deviations of results from quadruplicate experiments. (B) A two-dimensional clustering heat map shows M. tuberculosis genes expressed in a statistically significant manner for at least one PDS time point (0, 30, 60, 90, 120, or 180 min) relative to the pre-diamide induction time point. The intensity of the red color correlates with the degree of expression in wild-type M. tuberculosis relative to the level for the Δ-σH mutant, while the intensity of the blue color correlates with the degree of expression in the mutant relative to the level for wild-type M. tuberculosis. For each time point, changes are shown for two distinct microarrays, each of which was hybridized to a biologically independent RNA sample, along with an average value.

