
Figure 1. DNase-chip protocol.
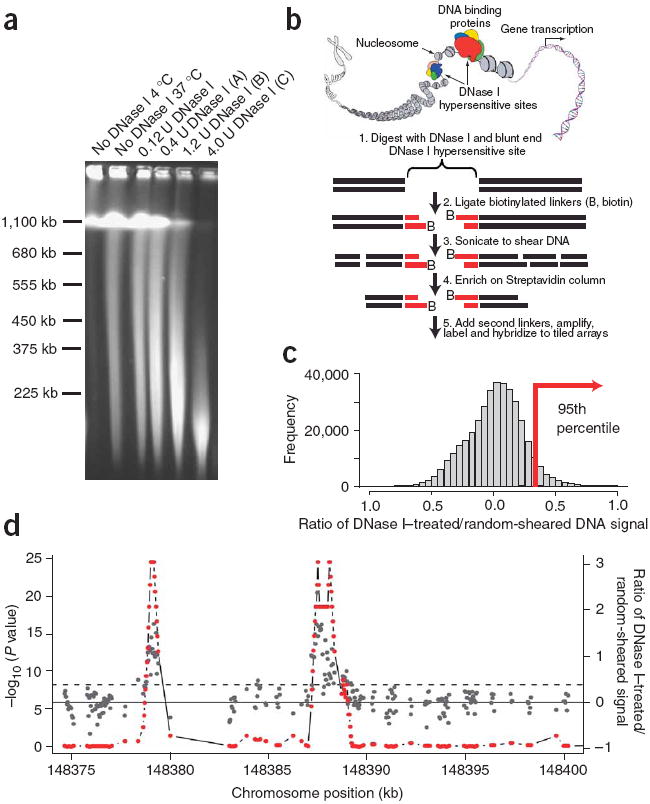
(a) Pulsed field gel electrophoresis of DNase I–digested nuclear DNA. The concentrations of DNase I used for DNase-chip are labeled as A, B and C. (b) Outline of DNase-chip protocol. (c) Histogram of signal ratios of DNase I–treated versus random-sheared DNA. Tiled oligos that displayed the top 5% ratios are located to the right of the red bar. (d) Identification of regions with significant P values. The raw ratio data are plotted in gray, with the y-axis label on the right; the top 5% cutoff is displayed as a dotted horizontal gray line. The P value data for sliding 500-bp windows are plotted in red, with the y-axis label on the left.