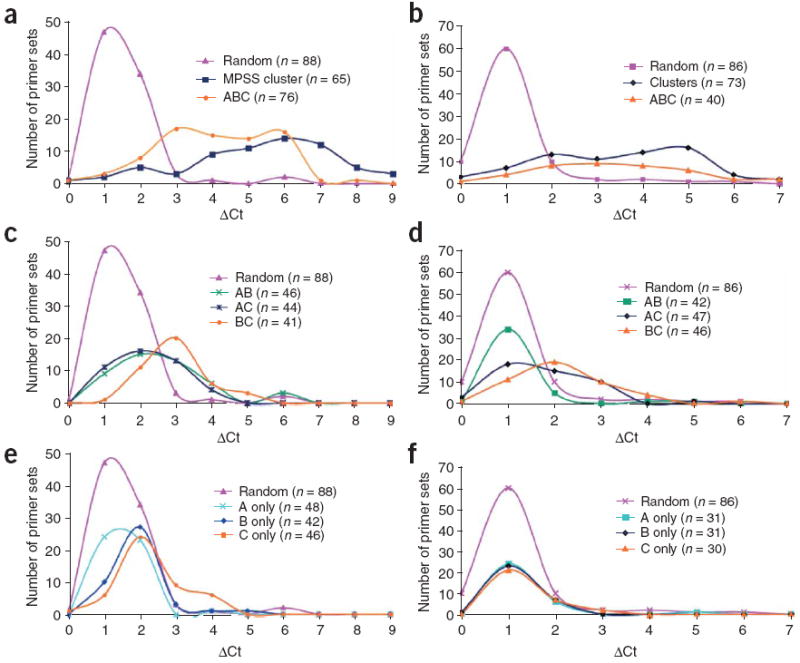
Figure 2. Confirmatory real-time PCR analysis.

(a–f) DNase-chip–identified regions were confirmed by real-time PCR for CD4+ T cells (a,c,e) and GM06990 cells (b,d,f). ΔCt values represent the number of additional cycles to achieve threshold levels of amplification between DNase I–treated and non-digested nuclear DNA. Higher ΔCt values represent elevated levels of DNase I–digestion. Control primer sets were designed around random regions of the genome, as well as known DNase I hypersensitive sites generated from a separate study8 (MPSS cluster). Real-time PCR using primer sets flanking DNase-chip peaks that are present with all three DNase I concentrations (a,b). Real-time PCR using primers sets flanking DNase-chip peaks that are present with two out of three DNase I concentrations (c,d). Real-time PCR using primer sets flanking DNase-chip peaks that are present with only a single DNase I concentration (e,f).
