
Figure 5. Location of DNase I hypersensitive sites relative to the annotated genome.
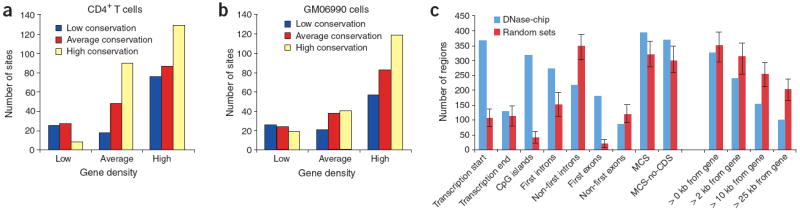
(a,b) DNase-chip peaks were mapped to ENCODE regions stratified by gene density and human-mouse sequence conservation for both CD4+ T cells (a) and the GM06990 lymphoblastoid cell line (b). (c) The genomic locations of DNase I hypersensitive sites (detected with at least two concentrations of DNase I) and computationally generated random controls (n = 1,000) were compared to Gencode transcription start and end sites (within a 2-kb window), CpG islands, first introns, non-first introns, first exons, non-first exons, conserved sequences (MCS), conserved sequences minus coding exons (MCS-no-CDS). The number of DNase I hypersensitive sites at different distances (0 kb, 2 kb, 10 kb, and 25 kb) from Gencode genes was also determined. Error bars represent the entire range of values seen randomly generated mock datasets (n = 1,000). Compared to the random controls, the locations of the DNase-chip peaks are significantly (Monte Carlo P < 0.001) over- or under-represented at all positions except transcription end and > 0 kb from gene.