
Figure 6. Expression of genes relative to proximity to DNase I hypersensitive sites.
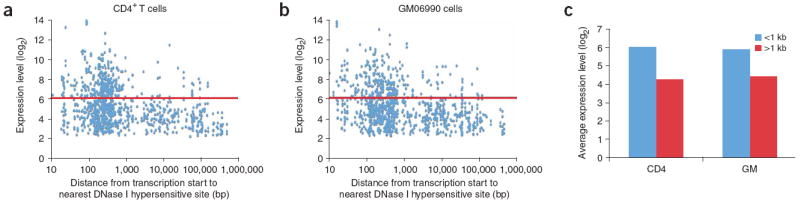
(a,b) The distance of each transcription start site (blue dots) to the nearest DNase I hypersensitive site was compared to the gene expression values of each transcript for both CD4+ T cells (a) and the GM06990 lymphoblastoid cell line (b). Horizontal red lines mark the expression level that separates most genes that have a DNase I hypersensitive site nearby (<1,000 bp) versus those that do not (>1,000 bp). (c) Average expression values of genes that have a DNase I hypersensitive site within 1 kb versus those that do not were determined for both cell types. Average expression values of genes that have a DNase I hypersensitive site are significantly different from genes that do not (P < 1 × 10−38). CD4+ T cells, CD4; or GM06990 cells, GM.