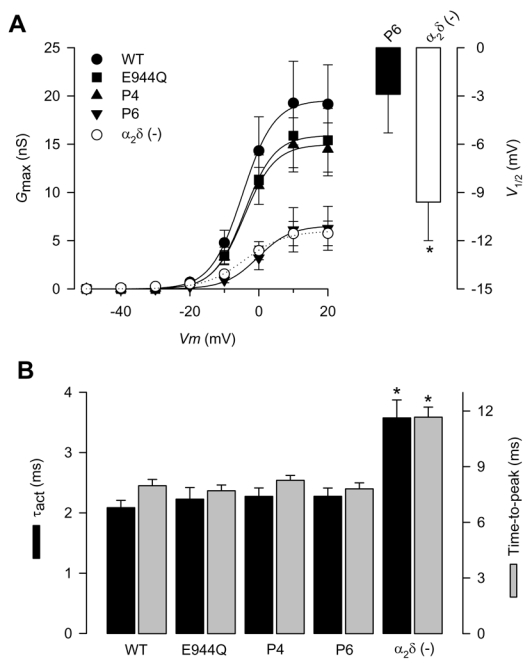
Figure 3. Activation properties of CaV2.2/β3 channels co-expressed with the wild-type α2δ-1or its proteolysis mutations.

A) Left, voltage dependence of activation of CaV2.2/β3 channels co-expressed with wild-type α2δ-1 (filled circles), its proteolysis mutants (E944Q, P4 and P6) or without any α2δ subunit (open circles). Maximum conductance (Gmax) plotted data were derived from Fig. 2B. The mean data were fitted with Boltzmann functions, the V½ values of which are given in Table 1. Right, comparison of the mean half-activation voltage (V1/2) for CaV2.2/β3 channels co-expressed with the P6 proteolysis mutation or without the α2δ subunit (n = 6–8). B) Mean time to peak and time constants of activation (τact) obtained by fitting the rising phase of IBa at +10 mV with a single exponential, for CaV2.2/β3 channels co-expressed with wild-type α2δ-1, its proteolysis mutants, or without any α2δ subunit (n = 11–25).
