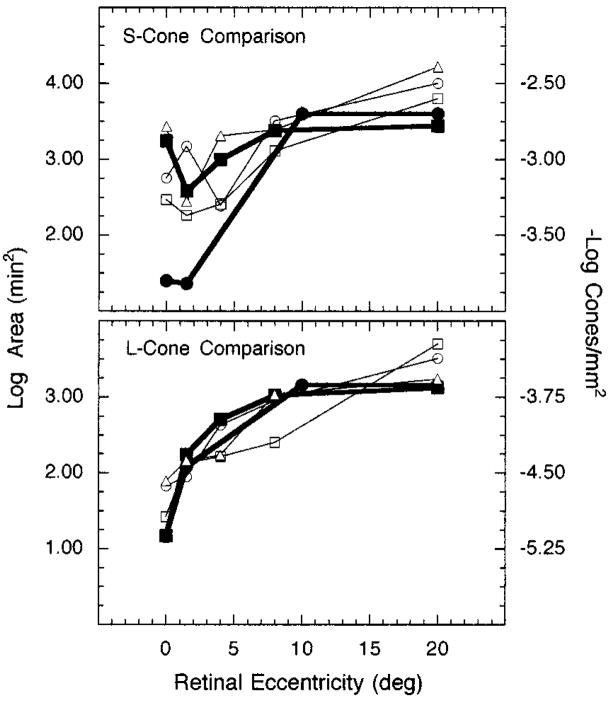
Fig. 6.
Log Ricco’s area at the retina and reciprocal log cone density plotted as a function of retinal eccentricity: Top, Ricco’s areas for an S-cone mechanism compared with S-cone density; bottom, Ricco’s areas for an L-cone mechanism compared with L-cone density. Each set of open symbols denotes a different observer. Filled squares and circles represent density values from Curcio et al.22,23 and Ahnelt et al.21, respectively.

