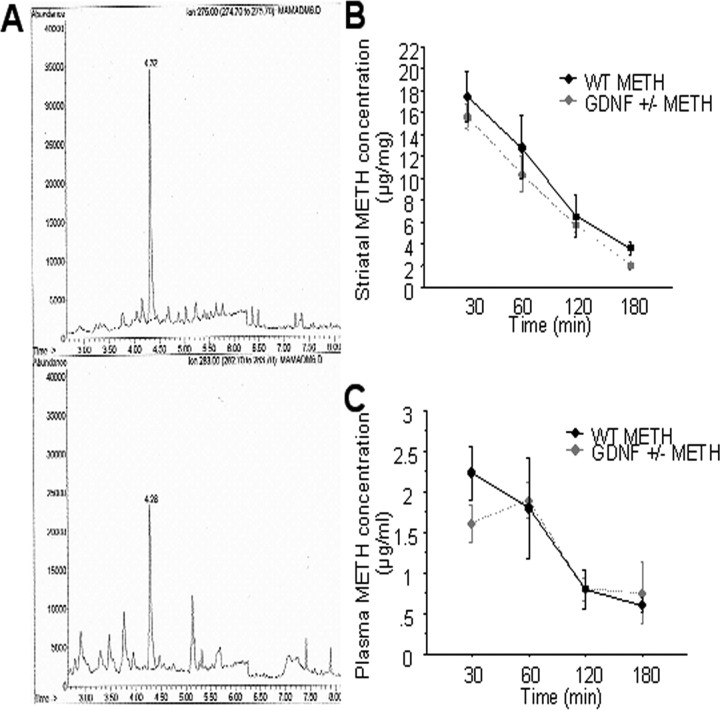
Figure 6.
A, Representative GC–MS–NiCl-selected ion-monitoring chromatogram of METH (top; retention time, 4.32 min) and internal standard deuterated METH (bottom; 4.28 min) extracted from a striatal microsample. B, C, Striatal METH concentration (micrograms per milligram of tissue) (B) and plasma METH concentration (microgram per milliliter) (C) did not differ between WT and GDNF+/− mice at 30, 60, 120, or 180 min after the fourth METH injection. n = 5 per group per time point. Error bars indicate SEM.

