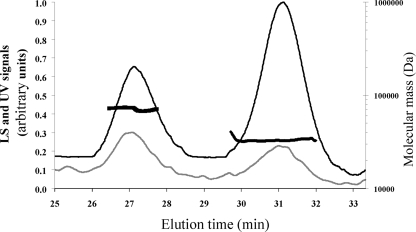
FIG. 2.
Gel filtration and DLS chromatograms of purified ResD. ResD protein was desalted on a G25 gel filtration unit, concentrated on an Amicon 5,000-Da-cut-off Ultra device (Amicon), and injected (∼80 μg in 70 μl) into a Superdex 200 column (HR 10/30) with 50 mM Tris-HCl (pH 8.3) and with 120 mM NaCl as the eluent, at a flow rate of 0.5 ml/min. The gray and black lines correspond to the light scattering (LS) signal and the UV signal recorded at 280 nm, respectively (y axis). LS signal noise was removed by moving average smoothing. The molecular mass estimates of the two major peaks are indicated by thick black broken lines (y axis).

