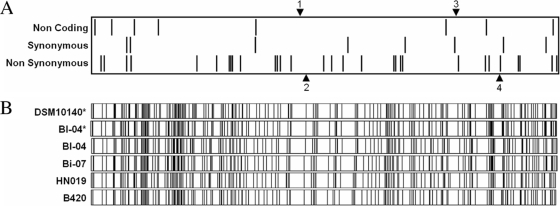
FIG. 1.
Alignment of B. animalis subsp. lactis genomes. Differences observed between the two B. animalis subsp. lactis genomes are shown in the figure. (A) SNPs are indicated using bars, with noncoding SNPs at the top, synonymous SNPs in the middle, and nonsynonymous SNPs at the bottom. INDELs are shown by arrows, with insertions in the Bl-04 genome shown on top and insertions in the DSM 10140 genome shown on the bottom. (B) Optical maps of various B. animalis subsp. lactis strains, visualized using OpGen MapViewer, based on a NotI digest. The first two optical maps were generated in silico (indicated by asterisks) based on the genome sequences. The other optical maps represent experimental data.

