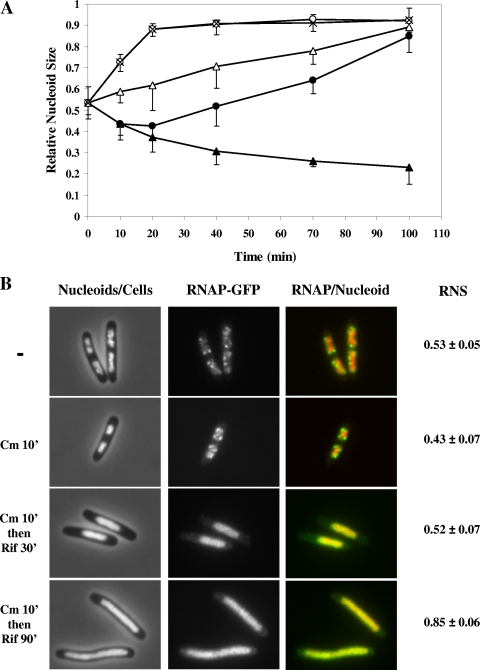
FIG. 1.
(A) Measurements of the RNS over time of the wild-type DJ2599 cells treated with chloramphenicol first, followed by rifampin. At time zero, the antibiotic(s) was added into cultures with an OD600 of ∼0.35. Open circles, rifampin; closed triangles, chloramphenicol; open triangles, chloramphenicol and rifampin simultaneously; crosses, rifampin for 10 min and then chloramphenicol; closed circles, chloramphenicol for 10 min and then rifampin. Note that the open circles overlap with crosses. The error bars in the figure indicate the deviations from the means. (B) Cell morphology, nucleoid size, and distribution of RNAP of the wild-type DJ2599 cells before and after sequential treatment with chloramphenicol (Cm) for 10 min and then rifampin (Rif) for 30 min and 90 min, respectively. In false-colored overlay images, RNAP is green and nucleoid is red.

