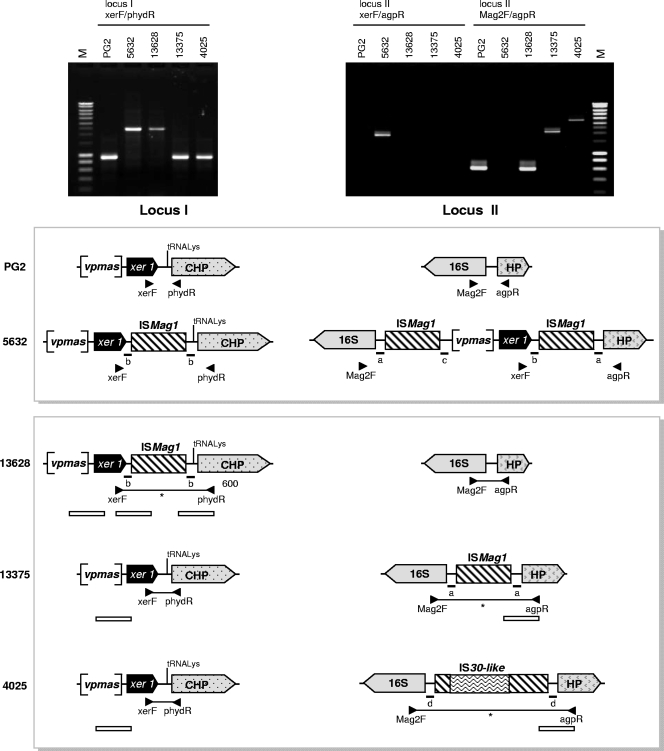
FIG. 3.
Comparison of vpma loci or their counterparts in M. agalactiae strains PG2, 5632 13628, 13375, and 4025. Pictures represent the amplification of locus I and/or II by use of primers xerF-phydR, xerF-agpR, and Mag2F-agpR, whose positions are indicated in the schematics by arrowheads. Schematics represent vpma locus I and vpma locus II or its counterpart. Brackets indicate vpma gene cluster localization next to the xer1 gene (filled black arrow). IS elements (ISMag1 or IS30-like) are indicated by hatched boxes or boxes with wavy lines. Lines traced between primers symbolize the PCR amplicons obtained, with asterisks indicating those which were directly sequenced. White bars below the loci indicate regions that were directly sequenced using genomic DNA. Small letters (a, b, c, and d) represent the 14-nt sequences that flanked the IS.

