FIG. 5.
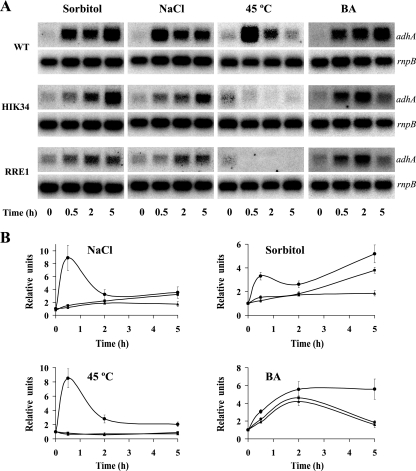
Expression of the adhA gene under stress conditions in wild-type (WT), Δhik34, and Δrre1 strains. (A) Northern blot analysis. Cultures at the exponential phase of growth were subjected to various stress conditions, and total RNA was extracted at different time points. Fifteen micrograms of total RNA was denatured, separated by electrophoresis in a 1.2% agarose gel, blotted, and hybridized with adhA. As a loading control, all the filters were rehybridized with rnpB. (B) Kinetics of expression of the adhA transcripts. The values in the graphs indicate the ratio of adhA transcripts in stressed cells to those in control cells. Three independent experiments were performed, and data plotted are the averages ± standard errors. •, wild-type strain; ▪, Δhik34 mutant strain; ▴, Δrre1 mutant strain.

