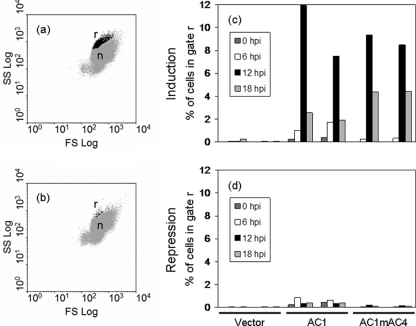
FIG. 5.
Flow cytometric analysis of cells expressing Rep protein. Induced (a) and noninduced (b) cells harboring plasmid pREP2:AC1 were fixed at 12 hpi, stained with propidium iodide, and analyzed by flow cytometry. A distinct subpopulation of cells (black dots; r) with increased forward scatter (FS Log) and side scatter (SS Log) properties compared to normal cells (gray dots; n) was gated for further analysis. Induced (c) and noninduced (d) cells harboring either empty plasmid (Vector), pREP2:AC1 (AC1), or pREP2:AC1mAC4 (AC1mAC4) were analyzed at different time points. Aliquots of cells were withdrawn after 0, 6, 12, and 18 h; treated as described before; and analyzed by flow cytometry. Cells of the subpopulation present in cultures expressing the Rep protein (r) were gated to determine the fraction of cells in this gate for the different cultures. For each construct, the results of two independent clones are shown.

