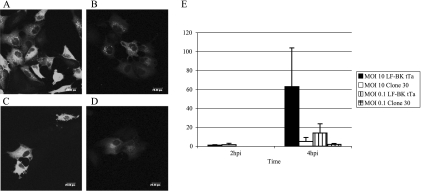
FIG. 6.
Immunofluorescence assay of LF-BK tTA cells and NTPDase6-expressing cell clone 30. Both cell types were infected with FMDV O/UK/2001 at an MOI of 10 (panels A and B, respectively) or at an MOI of 0.1 (panels C and D, respectively). After 4 hpi, cells were fixed for immunofluorescence staining using MAbs against the structural viral proteins and the secondary antibody goat anti-mouse immunoglobulin G labeled with Alexa Fluor 594 (Molecular Probes). The average fluorescence intensities of virus-infected cells (listed on the y axis) are shown in panel E. The scale shown in panels A through D is 20 μm.

