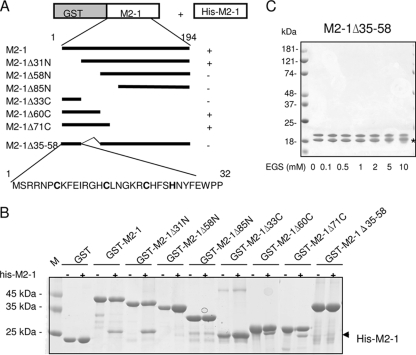
FIG. 6.
Analysis of M2-1 oligomerization and mapping of the M2-1 oligomerization domain. (A) Schematic representation of the deletion mutants of the GST-M2-1 fusion protein that were used to map the M2-1 oligomerization domain by coexpression with M2-1 in bacteria and sequence of the putative M2-1 ZnF motif. The column to the right summarizes the interactions between GST-M2-1 mutants and His-M2-1 analyzed as depicted in panel B. (B) Coomassie blue-stained SDS-12% polyacrylamide gel with purified GST-M2-1 deletion mutants expressed alone (−) or coexpressed with M2-1 (+) in E. coli. The arrowhead points to the His-M2-1 band. Lane M, molecular mass markers. (C) M2-1Δ35-58 cross-linking. Two micrograms of purified M2-1Δ35-58 free of RNA was subjected to cross-linking and analyzed as described in the legend to Fig. 3. The upper band corresponds to M2-1Δ35-58, and the faster-migrating band indicated by a star results from an N-terminal cleavage of the M2-1Δ35-58 protein.

