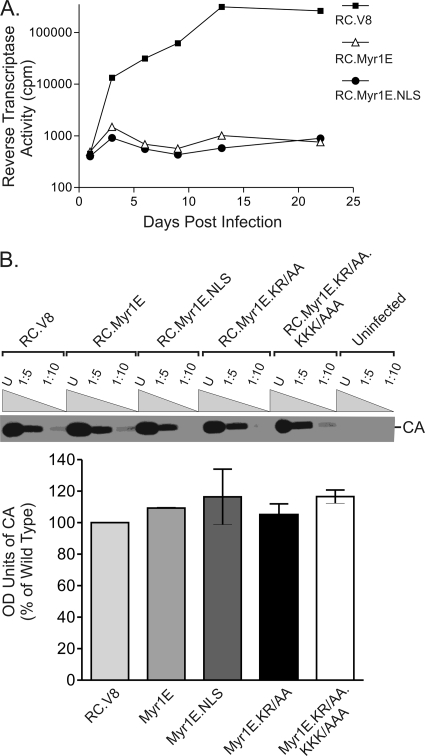
FIG. 5.
Viral infectivity. (A) Virus particles were collected from the cell culture medium 48 h after transient transfection with wild-type or mutant proviral constructs. Infection was accomplished by adding equivalent numbers of virus particles to fresh QT6 cells for 3 hours. Cells were passaged every 3 days, and samples of culture medium collected at each time point were assayed for RT activity at the end of a 21-day period. (B) The CA-to-RT ratio for each virus was determined by collecting virus particles and normalizing for equivalent particle numbers according to RT activity. The indicated dilutions of normalized virus particle samples (U for undiluted, 1:5 for 5-fold dilutions, and 1:10 for 10-fold dilutions) were loaded onto an SDS-PAGE gel, and Western blot analysis was performed using anti-RSV polyclonal serum. The intensities of CA bands on Western blots were quantitated using ImageJ software, and the results are presented in the graph. The averages of results from three separate experiments along with the standard errors of the means are shown. OD, optical density.

