FIG. 5.
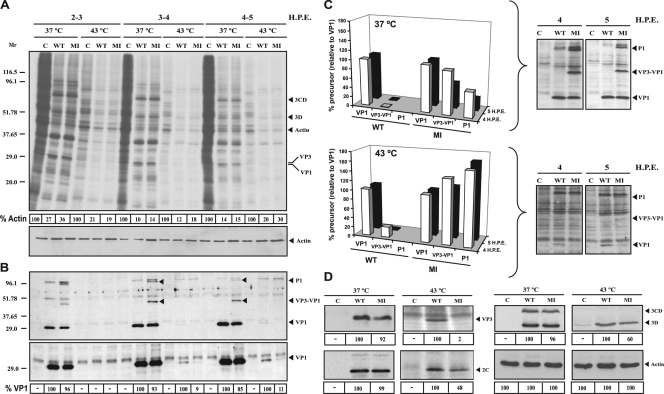
Protein expression by wild type RNA and mutant M54I RNA. (A) Pattern of protein expression in BHK-21 cells electroporated with transcripts encoding pMT28-WT (WT) and pMT28-M1054I (MI) at 37°C and 43°C. BHK-21 cells were either mock electroporated (C lanes) or electroporated with about 20 μg of RNA transcripts from the indicated plasmids. Transfected cells were labeled with [35S]Met-Cys at 2 to 3, 3 to 4, or 4 to 5 h postelectroporation (HPE). Cell extracts were analyzed by SDS-PAGE, followed by fluorography and autoradiography. The extent of shutoff of host cell protein synthesis was determined by the amount of 35S label in the actin band (as a percentage of the C lane, taken as 100%; values are given in the boxes below each lane). The total amount of protein was determined by Western blotting using a monoclonal antibody specific for β-actin (bottom panel). The positions of viral proteins 3CD, 3D, VP3, and VP1 are indicated on the right. Mr values are in thousands. (B) Western blot analysis of the gel shown in panel A using monoclonal antibody SD6, specific for VP1 of FMDV. The positions of P1, VP3-VP1, and VP1 are indicated. P1 and VP3-VP1 were also positive with monoclonal antibody 6C2, which is specific for VP3 (38). The second blot is a longer exposure of the gel region around VP1; the percentage of pMT28-M1054I VP1 relative to pMT28-WT VP1, given at the bottom, was determined by densitometry of the VP1 bands using the appropriate exposure for each temperature (−, no density above the background was detected). Indication of FMDV proteins and molecular mass markers are as in panel A. (Our analysis did not determine whether the bands assigned to P1 and VP3-VP1 included 2A [50, 51, 56]). (C) A three-dimensional representation of the data shown in panel B at 3 to 4 (4 HPE) and 4 to 5 (5 HPE) h postelectroporation. The percentages of precursor proteins for the wild type (WT) and mutant M54I (MI) viruses at 37°C and 43°C were determined by densitometry of a Western blot with the appropriate exposure (shown on the right); the results are relative to the VP1 level, taken as 100%. (D) Western blot analysis using antibodies specific for VP3, 2C, and 3D of FMDV and β-actin at 4 h postelectroporation. The percentages at the bottom of the blots were determined by densitometry of the specific bands with the appropriate exposure for each temperature (−, no density above the background was detected). Procedures are described in Materials and Methods.

