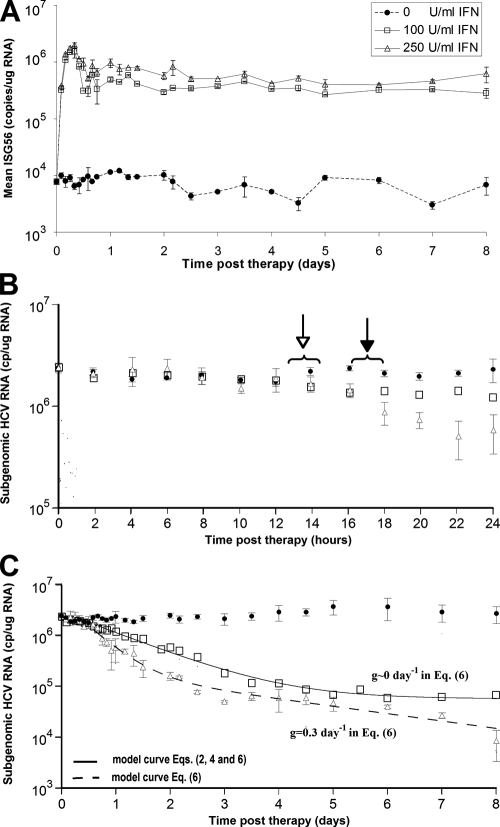
FIG. 3.
Kinetic analysis and modeling of the in vitro data for doses of 100 and 250 U/ml of IFN-α. HCV replicon cells were incubated with 100 or 250 U/ml of IFN-α, and triplicate RNA samples were collected for real-time qPCR analysis every 2 h from 0 to 24 h, every 4 h from 24 to 60 h, and then every 12 h until day 8. (A) RT-qPCR analysis of ISG56 mRNA levels in mock-treated cell (circles) and in cells treated with 100 U/ml (squares) and 250 U/ml (triangles) IFN-α throughout the 8-day experiment. (B) RT-qPCR analysis of sg1b HCV RNA levels in mock-treated cells (circles) and in cells treated with 100 U/ml (squares) and 250 U/ml (triangles) IFN-α during the first 24 h of treatment. Open arrow, sg1b RNA levels in IFN-α-treated cells significantly (P = 0.05) lower than in control cells; filled arrow, sg1b RNA levels in 250 U/ml IFN-α-treated cells significantly (P = 0.05) lower than in 100 U/ml IFN-α-treated cells. (C) Fit of model equations to sg1b RNA decline data. Solid line denotes the best fit of equations 2 and 4 or equation 6 with g of ∼0 to HCV RNA levels obtained with 100 U/ml IFN-α. Dashed line indicates the best fit of equation 6 to the measured 250-U/ml IFN-α sg1b RNA levels. The parameter values that generated the best-fit theoretical curves (solid and dashed lines) are shown in Table 2. The size of the squares represents the largest standard error of the mean of sg1b RNA. Vertical lines represent standard error of the mean.

