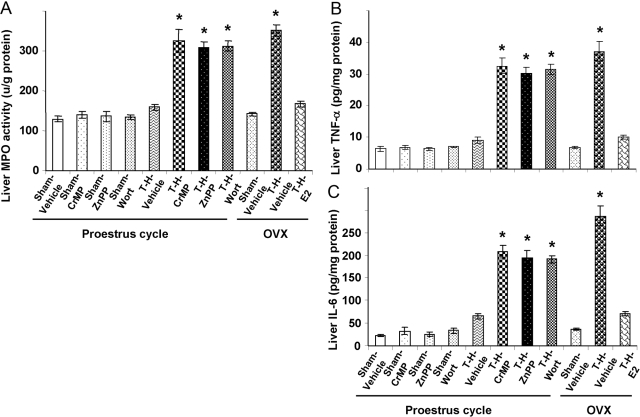
Fig. 8.
Alterations in liver MPO activity (A), TNF-α (B), and IL-6 (C) in Sham-Veh, Sham-CrMP, Sham-ZnPP, Sham-Wort, T-H Veh, T-H-CrMP, T-H-ZnPP, T-H-Wort, OVX-Sham-Veh, OVX-T-H-Veh, and OVX-T-H-E2 groups. There are six rats in each group. Data are expressed as mean ± se and compared by one-way ANOVA and Tukey’s test. *, P < 0.05, versus PE-sham.

