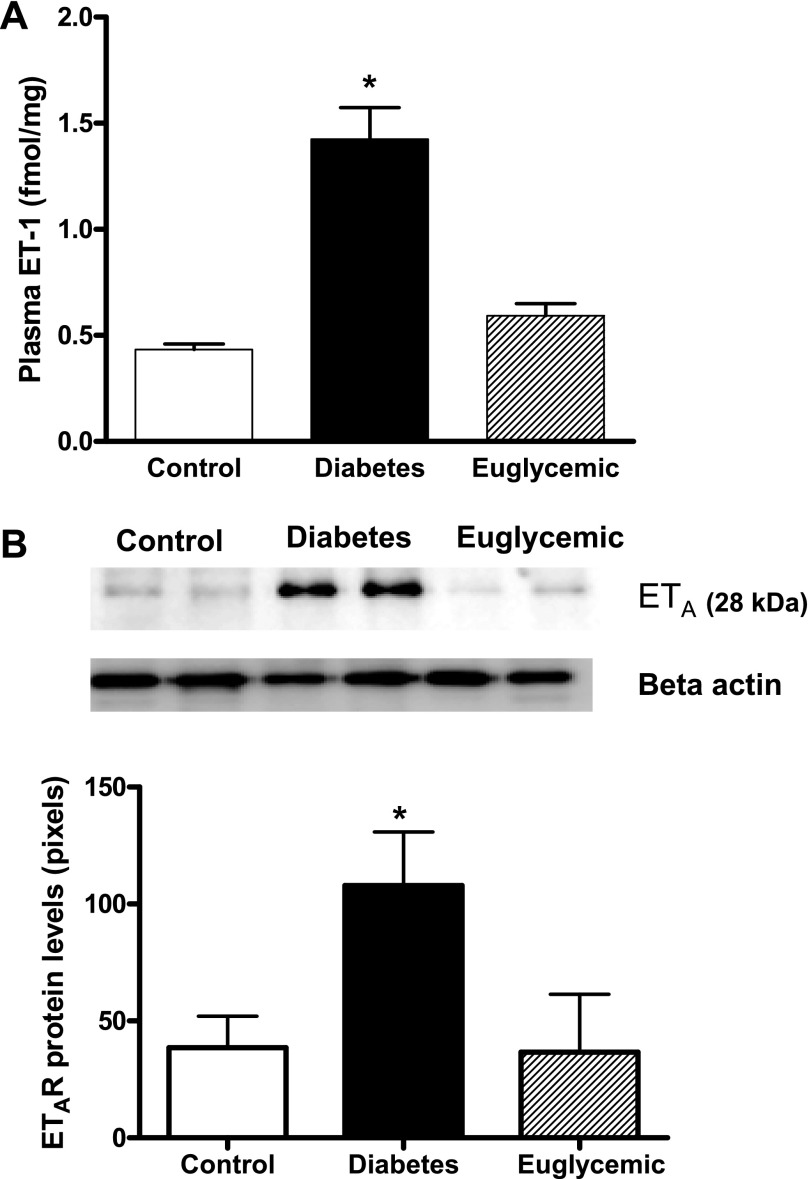
Fig. 6.
Plasma ET-1 and ET receptor expression in mesenteric arteries. A: ET-1 levels are increased three-fold in diabetes, which was prevented by glycemic control. B: representative immunoblot showing ETA protein levels and densitometric analysis indicated an increase in ETA in diabetes and metformin treatment normalized receptor expression to control values. Densitometry values reported have been normalized to β-actin levels in all samples to account for differences in loading. *P < 0.05 vs. control or euglycemic; n = 6/group.

