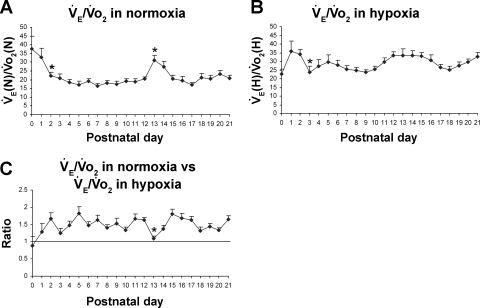
Fig. 4.
Postnatal changes in V̇e/V̇o2 ratios in normoxia and hypoxia. A: V̇e/V̇o2 ratios in normoxia [V̇e(N)/V̇o2 (N)]. The ratio was highest at P0 and decreased significantly at P2, followed by a relative plateau until P12. It then increased abruptly and significantly at P13, decreased at P14 and P15, and plateaued thereafter until P21. B: V̇e/V̇o2 in hypoxia [V̇e(H)/V̇o2(H)]. V̇e/V̇o2 response fluctuated from P0 through P21, with the lowest level at P0 and a significant decrease at P3. C: V̇e/V̇o2 in hypoxia vs. that in normoxia. One-sample t-test indicated that in the majority of age groups, the ratio was significantly different from 1 (P < 0.05), except for P0, P1, P3, and P13. P13 is the only time point that shows a statistically significant difference between any adjacent 2 age groups (P < 0.05). For statistical comparisons between successive age groups, please see methods. *P < 0.05.

