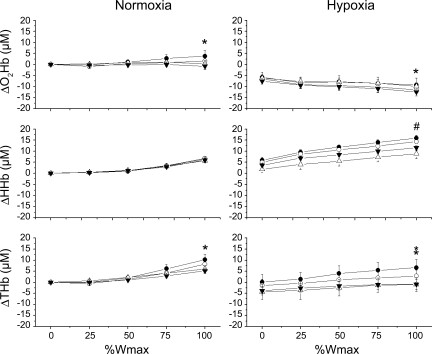
Fig. 3.
Regional changes in cerebral oxygenation during incremental exercise (n = 11). Continuous recordings obtained across conditions are shown as change from Norm at rest. O2Hb, oxyhemoglobin; HHb, deoxyhemoglobin; THb, total hemoglobin. Patterns of deoxygenation are similar in right prefrontal (○), left prefrontal (•), left premotor (▵), and left motor (▴) cortices. Extent of deoxygenation is greater in Hypox (P < 0.05). Note slight regional differences at 100% Wmax. *P < 0.05, right prefrontal > left prefrontal. #P < 0.05, left prefrontal > left premotor and motor.

