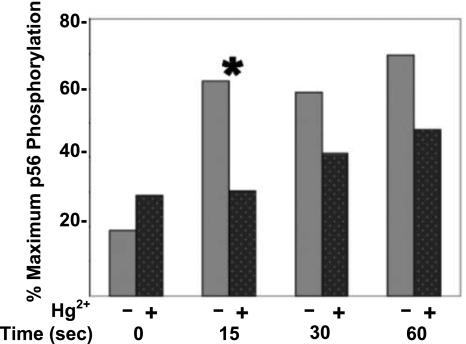
Figure 2.
Hg2+ rapidly and transiently attenuates the tyrosine phosphorylation of a phospho(tyrosine) protein of 56 kDa (p56). A quantitative analysis of the results depicted for the 56-kDa band in Fig. 1 was undertaken. For each of 12 independent experiments, Western blot images were scanned, and the density of the 56-kDa band was integrated over the band area to arrive at a measure of phosphorylation in cells that had been treated with mercury (dark gray, dotted bars) and those that had not (light gray bars). Within each experiment, the band with the greatest tyrosine phosphorylation was assigned a value of 100% and was considered maximally phosphorylated. The (0) time-point band with the least tyrosine phosphorylation (either with or without Hg2+) was assigned a value of 0%, and the relative maximum percentage of tyrosine phosphorylation in the other bands was determined. Maximum phosphorylation percentages determined for each time point were averaged over all experiments, and the results were plotted. Results between Hg2+-treated and untreated cells are only statistically different for the 15-s time point. *P < 0.05; paired Student’s t test.

