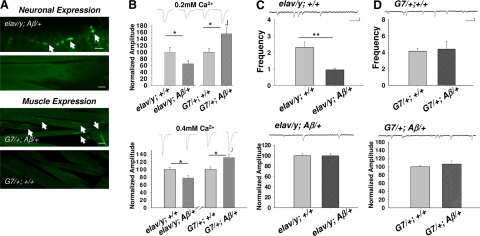
Figure 1.
Opposite synaptic effects resulting from expression of Aβ42 in neurons vs. muscle cells. A) Distribution of immunohistochemical staining of the Aβ42 peptide via antibody 6E10 in motor nerve terminals of elav-Gal4/y; UAS-Aβ/+ (elav/y; Aβ/+ in figure labels) larvae and in muscle cells of G7/+; Aβ/+ larvae. Elav is a pan-neuronal driver; G7 is a muscle-specific driver. Top panels: arrows indicate boutons of nerve terminals with positive anti-Aβ42 peptide staining. Bottom panels: arrows indicate fiber-like staining within muscle cells. Scale bars = 15 μm (top); 100 μm (bottom). B) EJCs were depressed in elav/y; Aβ/+ larvae while enhanced in G7/+; Aβ/+ larvae. EJC amplitude is normalized to the size of a respective control group (see Materials and Methods). Ca2+ concentrations are as indicated. n = 10, 11, 26, 24, 8, 8, 9, 10 for elav/y; +/+, elav/y; Aβ/+, G7/+; +/+, G7/+; Aβ/+ at 0.2 and 0.4 mM Ca2+, respectively. Scale bars = 5 nA (vertical, top); 10 nA (vertical, bottom); 7.5 ms (horizontal). C, D) Quantal analysis of effects of Aβ42 expression. Frequency of spontaneous mEJCs was significantly lower in neuronal expression of Aβ42 (elav/y; Aβ/+) vs. its control (C); frequency was similar in muscle expression of Aβ42 (G7/+; Aβ/+) (D). Amplitude of mEJCs remained unchanged in both cases. n = 10, 9, 20, 11 for elav/y; +/+, elav/y; Aβ/+, G7/+; +/+, G7/+; Aβ/+, respectively. Scale bars = 0.4 nA (vertical); 130 ms (horizontal). Error bars = se. *P < 0.05, **P < 0.01; test.

