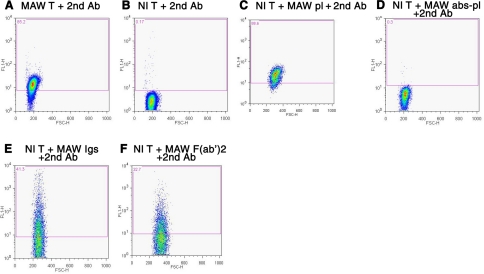
Figure 1.
Flow-cytometric analyses of immunoglobulins on patient MAW and healthy control T cells. T-cell suspensions were incubated with plasma or Igs and/or FITC-conjugated affinity-purified F(ab′)2 of donkey anti-human IgG (H+L chain-specific) Abs (FITC-a-IgG-H+L), termed the 2nd Ab. Number in top left corner of each frame is percentage of T cells staining positive at a level above that of the background control. A) MAW T cells + FITC-a-IgG-H+L alone. B) Normal T cells + FITC-a-IgG-H+L alone. C) Normal T cells + MAW plasma 1:100 + FITC-a-IgG-H+L. D) Normal T cells + MAW plasma 1:100 after protein A/G absorption + FITC-a-IgG-H+L. E) Normal T cells + MAW purified Igs, 1 μg/ml + FITC-a-IgG-H+L. F) Normal T cells + MAW purified F(ab′)2, 0.3 μg/ml + FITC-a-IgG-H+L.

