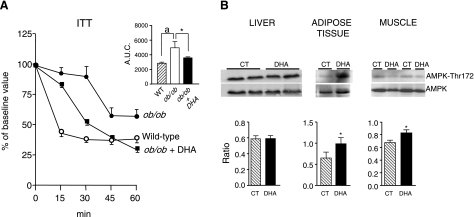
Figure 4.
Effects of the ω-3-PUFA DHA on insulin tolerance and AMPK phosphorylation in ob/ob mice. A) Insulin tolerance test curves were performed in wild-type mice (n=4) and in ob/ob mice (n=5) receiving saline and in ob/ob mice receiving DHA at a dose of 4 μg/g body weight (n=5) every 12 h for 4 d. Mice received an intraperitoneal injection of recombinant insulin (0.0075 U/g body weight), and blood samples were collected from the tail 0, 15, 30, 45, and 60 min later for serum glucose determination. Inset: analysis of area under the curve (AUC) for these experiments. Results are expressed as means ± se. aP < 0.05 vs. WT; *P < 0.05 vs. ob/ob group treated with saline. B) AMPK phosphorylation was determined in samples of liver, adipose, and muscle tissues obtained from control ob/ob mice (CT; n=8) and ob/ob mice receiving the ω-3-PUFA DHA (n=8). Equal quantities of total protein (50 μg liver, 80 μg adipose tissue, and 100 μg muscle tissue) were separated by SDS-PAGE and analyzed by Western blot. Top and bottom blots represent protein bands detected by specific anti-AMPK phosphorylated on the residue Thr172 or by specific anti-total AMPK antibodies, respectively. Densitometric analysis of the phosphorylated AMPK-to-total AMPK ratio from these blots is shown at bottom. Results are expressed as means ± se. *P < 0.05 vs. CT group.

