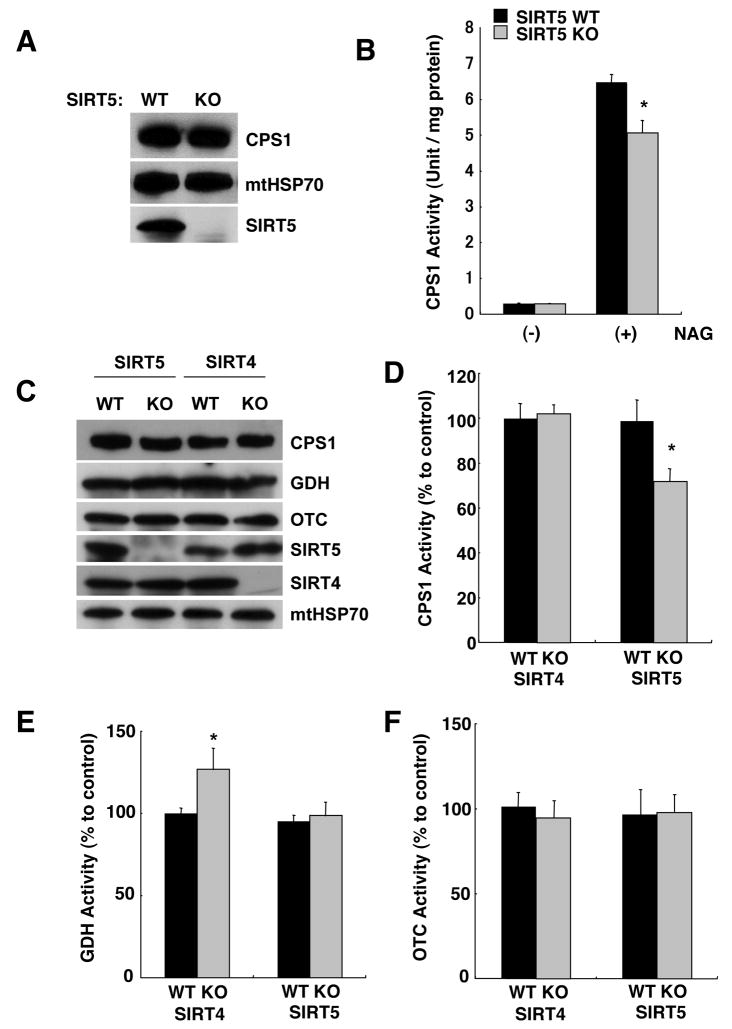
Figure 3. CPS1 activity is decreased in SIRT5 KO mice, but not in SIRT4 KO mice.
(A) Liver mitochondria matrix lysates were prepared from SIRT5 KO and wild type littermate controls, and subjected to western blotting with anti-SIRT5, anti-CPS1 and anti-mtHSP70 antibodies.
(B) Liver mitochondria matrix lysates from SIRT5 KO and wild type mice fed ad libitum were assayed for CPS1 activity in the presence or absence of 10mM N-acetyl glutamate (NAG), an allosteric activator. CPS1 activity is shown as unit/mg protein. Error bars represent standard deviations. (n=8 for each groups).
(C) Immunoblots show SIRT5, SIRT4, GDH, CPS1, OTC and mtHSP70 protein levels in liver mitochondria matrix lysates prepared from SIRT5 KO, SIRT4 KO and their wild type littermate controls fed ad libitum. Neither SIRT KO affected the protein levels of the urea cycle enzymes or each other.
(D) CPS1 activity was measured in liver mitochondria matrix lysates from SIRT4 KO, SIRT5 KO and their wild type littermate controls fed ad libitum. CPS1 activity is shown as % of wild type. Error bars represent standard deviations. (n=8 for each groups)
(E) GDH activity was measured by monitoring NADH 340nm absorbance (Haigis et al., 2006). Liver mitochondria matrix lysates from SIRT4 KO, SIRT5 KO and their littermate controls fed ad libitum were assayed. GDH activity is shown as % of wild type. Error bars represent standard deviations. (n=6 for each groups)
(F) OTC activity was determined by measuring converted citrulline by the colorimetric method. Liver mitochondria matrix lysates from SIRT4 KO, SIRT5 KO and their control mice fed Ad libitum were assayed. OTC activity is shown as % to control. Error bars represent standard deviations. (n=4 for each groups)

