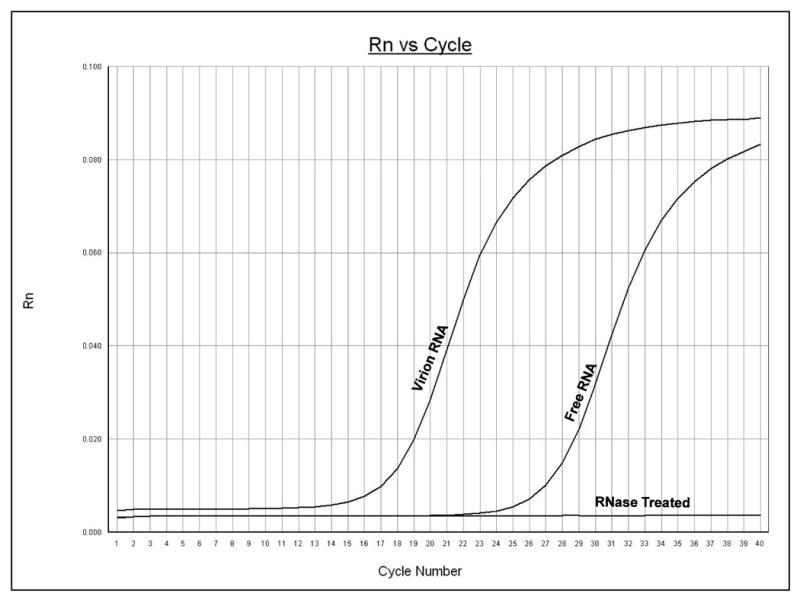
Figure 3.

Detection of RNA directly from viral stocks. Poliovirus stock samples were analyzed by qRT-PCR using poliovirus primers. The y-axis represents fluorescence and the x-axis represents cycle number. The increase in fluorescence at a particular cycle number represents the cycle threshold (Ct) for that sample, which indicates the detection of nucleic acids. The PCR was carried out for 40 cycles. Graph shows amplification from a representative well. Free RNA represents the signal detected when viral stocks were used directly for cDNA synthesis, i.e., without disrupting virions. Virion RNA represents the signal detected when stocks were first digested with RNase to remove free RNA followed by purification under denaturing conditions to release virion-associated RNA. RNase Treated represents the signal observed when stocks were treated with RNase and then used directly for cDNA synthesis.
