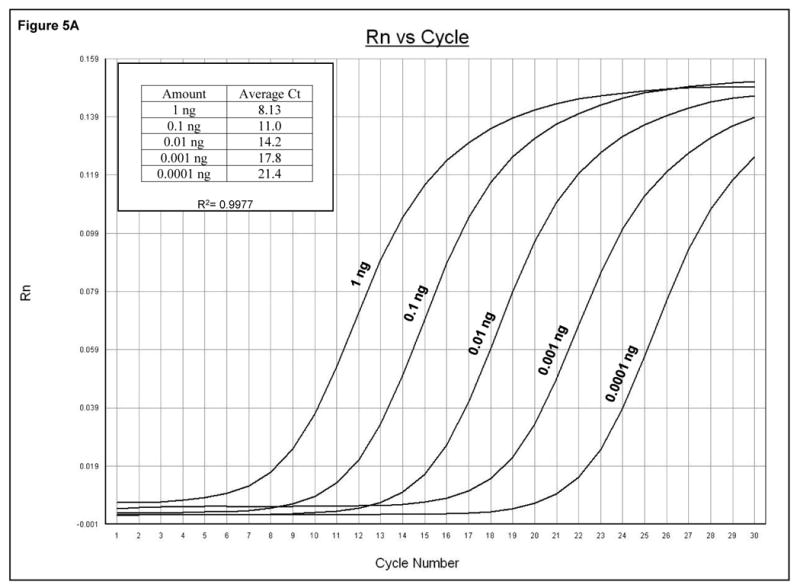
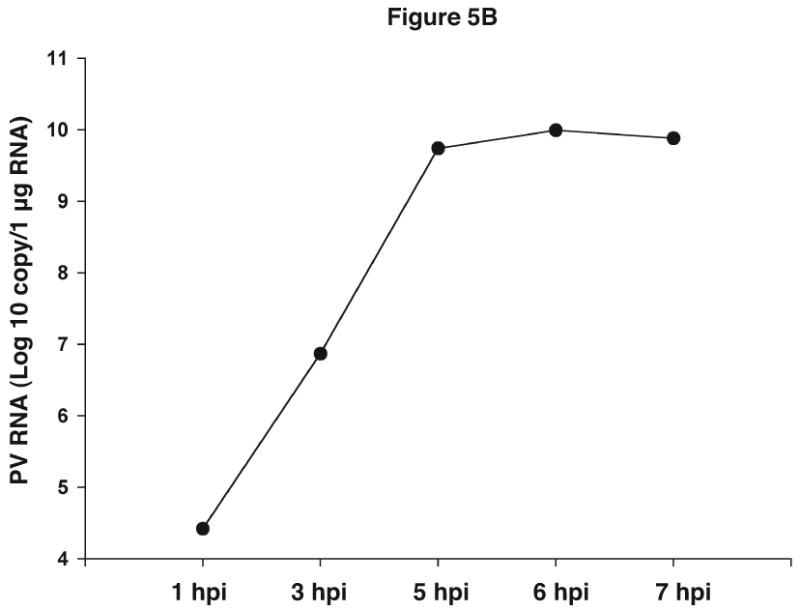
Figure 5.


Quantitative analysis of viral sequences. A. qRT-PCR was conducted on 10-fold serial dilutions of a plasmid harboring the complete PV1 genome using the PV1 primer set that amplifies a 171 bp product. The y-axis represents fluorescence and the x-axis represents cycle number. The PCR was carried out for 30 cycles. Graph shows amplification from a representative well. The amount of plasmid DNA and the corresponding average Ct from triplicate samples are indicated in the upper left. R2 value obtained from the standard curve generated by plotting Ct values against plasmid copy number is shown. B. Total RNAs were extracted from uninfected or PV1-infected cells at an MOI of 10 at the indicated times post-infection and analyzed by qRT-PCR with primers for both PV1 and β-actin mRNAs. PV1 RNA copy number was determined from the standard curve obtained in A. The amount of PV1 RNA was normalized to the amount of β-actin mRNA using 1 hpi as reference. Values on the y-axis are expressed after log10 transformation. The data represents viral RNA levels from a representative experiment. hpi: hours post infection.
