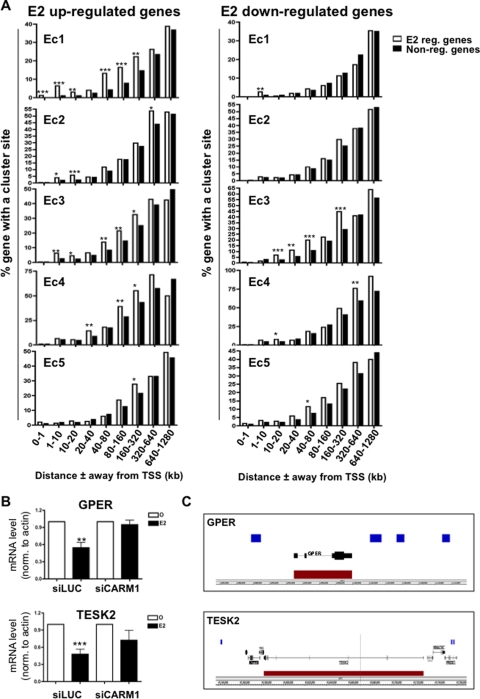
FIG. 3.
Clusters associated with CARM1 activation drive the response under E2 treatment. (A) Proportion of E2 upregulated genes compared to nonregulated genes with at least one binding site from a specific cluster within increasing window distances from their TSS in MCF7 cells. *, P ≤ 0.05; **, P ≤ 0.01; ***, P ≤ 0.001. (B) GPER and TESK2 expression after CARM1 silencing in MCF7 was determined by reverse transcription-qPCR and revealed the requirement for CARM1 in the E2-induced repression of GPER and TESK2. siLUC was used as a control. *, P ≤ 0.05; **, P ≤ 0.01; ***, P ≤ 0.001. (C) Enrichment of Ec3 cluster sites (blue blocks) near GPER and TESK2 E2-downregulated target genes (red blocks).

