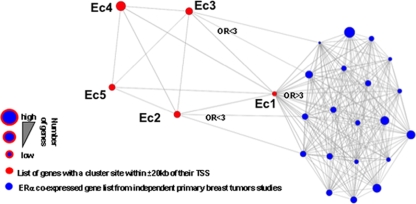
FIG. 4.
ERα-positive primary breast tumor expression profile relates to clusters associated with CARM1 activation. Relationship between cluster-associated gene list (genes with a binding site from a given cluster within 20 kb of their TSS) and genes overexpressed in ERα-positive primary breast tumors (the top 1, 5, or 10% overexpressed genes from primary breast tumors were included in the analysis). Twenty independently defined ERα-positive primary breast tumor overexpressing gene signatures (blue) were compared using an Oncomine Concepts Map to the five enhancer clusters (red) derived gene lists. Odds ratios (OR) are presented when clusters are significantly associated with independent primary breast cancer overexpression gene signatures (P ≤ 6e−6).

