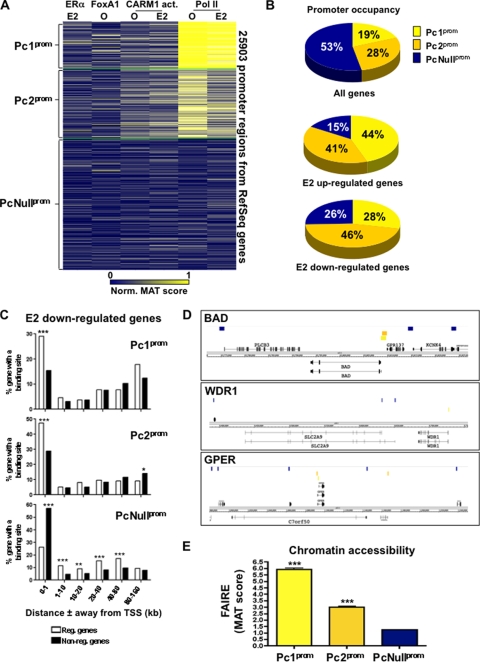
FIG. 6.
Pol II occupied promoter of E2 target genes prior to stimulation. (A) Cluster analysis performed as described for Fig. 1A across the 25,903 promoter regions associated with the RefSeq genes. (B) Proportions of all, E2-upregulated, and downregulated genes with a promoter typical of clusters Pc1prom, Pc2prom, or PcNullprom. (C) Enrichment of E2-downregulated versus nonregulated genes with at least one promoter of the Pc1prom, Pc2prom, or PcNullprom cluster within increasing window distances from the genes' TSS. (D) Specific examples of E2 downregulated genes surrounded by gene with Pol II deprived promoters. Sites from cluster Pc1prom (orange), Pc2prom (pink), or PcNullprom (dark blue) are presented with respect to E2-downregulated genes (red block). (E) Relative chromatin accessibilities of promoters from cluster Pc1prom, Pc2prom, or PcNullprom measured by FAIRE-ChIP. *, P ≤ 0.05; **, P ≤ 0.01; ***, P ≤ 0.001.

