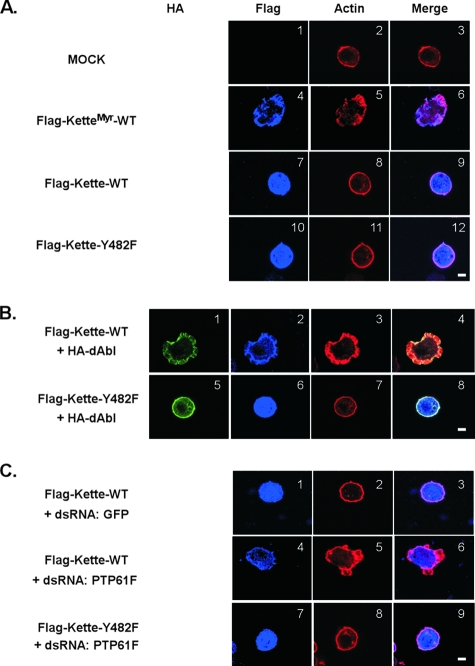
FIG. 6.
Subcellular localization of Kette, actin organization, and lamella formation in S2 cells on ConA. Transfected S2 cells were replated on ConA-coated coverslips for 7 min and then subjected to immunofluorescent staining. The images were obtained by confocal microscopy. (A) The cortical F-actin pattern was observed in mock transfectants attached on ConA (images 1 to 3). Ectopically expressed KetteMyr that was localized to the plasma membrane (image 4) led to reorganization of F-actin and formation of lamella (image 5). Upon cell spreading, KetteMyr and F-actin were colocalized near the plasma membrane (image 6). Ectopically expressed cytosolic Kette was distributed evenly in cells (image 7) without effects on the organization of F-actin or the formation of lamella (images 8 and 9). Similar results were observed when cytosolic Kette-Y482F was expressed in S2 cells (images 10 to 12). (B) In response to ectopic expression of dAbl (image 1), cytosolic Kette was localized to the plasma membrane (image 2), concomitant with F-actin reorganization and lamella formation (images 3 and 4). Upon cell spreading, dAbl, Kette, and F-actin were colocalized near the plasma membrane (image 4). In contrast, the cytosolic Kette-Y482F mutant was distributed evenly in cells when dAbl was coexpressed (images 5 and 6). The cortical F-actin was observed in transfectants expressing Y482F-Kette, independently of the levels of dAbl in cells (images 11 and 12). (C) dsRNA for green fluorescent protein (GFP) (images 1 to 3) or PTP61F (images 5 to 9) was used to treat S2 transfectants expressing cytosolic Kette or Kette-Y482F. In response to knockdown of PTP61F, cytosolic Kette was localized to the plasma membrane (image 4), concomitant with reorganization of F-actin and formation of lamella (images 5 and 6). When PTP61F was ablated, cytosolic Kette-Y482F was distributed evenly in cells (image 7) and F-actin remained in its cortical pattern (images 8 and 9). Under these conditions, S2 transfectants were unable to form lamella (images 7 and 9). Bars, 5 μM. The images are representative of multiple independent experiments with similar results. Under the experimental conditions applied, we routinely observed ∼90%, 50 to 60%, or 70 to 80% Flag-positive cells with the phenotype of lamella formation in response to KetteMyr overexpression, Kette overexpression combined with PTP61F knockdown, or Kette and dAbl cooverexpression, respectively.

