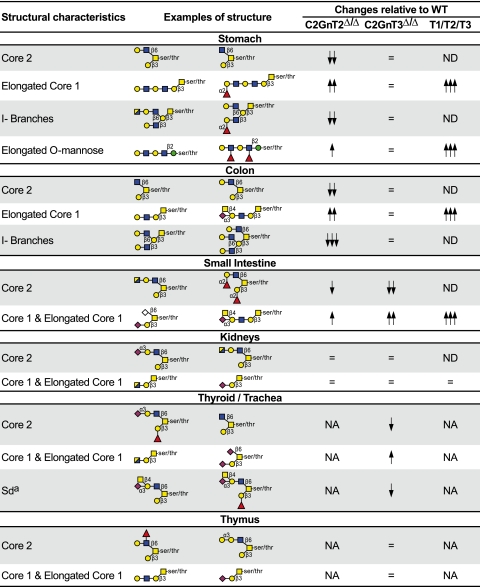
FIG. 8.
O-glycan structures in the presence or absence of C2GnTs. The structural changes described here are based on MALDI-TOF/TOF-MS and MS/MS data. WT, wild-type mice; C2GnT2Δ/Δ, C2GnT2-deficient mice; C2GnT3Δ/Δ, C2GnT3-deficient mice; T1/T2/T3, C2GnT triply deficient mice. NA, not analyzed, ND, not detected; =, no significant changes; ser, serine; thr, threonine. Upward arrows indicate increases, and downward arrows indicate decreases. The number of arrows is indicative of the magnitude of the change, with three arrows being the greatest (>75%) and one arrow being the smallest (<25%) percentage of change compared to the wild type. Linkages are assigned to the known biosynthetic pathways. Color symbols: yellow square, GalNAc; blue square, GlcNAc; half-blue/half-yellow square, GalNAc or GlcNAc; yellow circle, galactose; green circle, mannose; purple diamond, N-acetylneuraminic acid; white diamond, N-glycolylneuraminic acid; red triangle, fucose.

