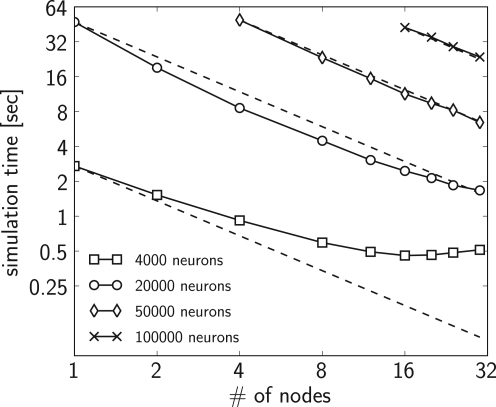
Figure 2.
Simulation times of the CUBA network distributed over different number of processing nodes, compared to the expected simulation time (dashed line) (see text for details). Four different sizes of networks were simulated: 4000 neurons with on average 1.6 × 10⁶ synapses (squares), 20000 neurons with on verage 40 × 106 synapses (circles), 50000 neurons with on average 250 × 106 synapses (diamonds) and 100000 neurons with on average 1 × 10⁹ synapses (crosses). The plotted simulation times are averages over 12 simulation runs. The variation of simulation time between different simulation runs was small, therefore we did not show it.

