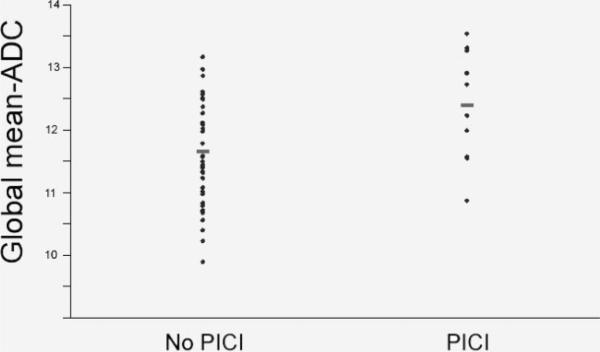
Figure.
Box-and-whisker plots of global mean ADC in subjects with and without PICI. ADC values are expressed in as mean ADC×10-4 mm2/s. Box borders represent the 25th and 75th percentiles, the middle bar is at the median, and the whiskers extend to 1.5 interquartile ranges. Statistical testing is by Student t test. *P=0.03.

