

Abstract
MicroRNAs (miRNAs) are small RNA molecules that negatively regulate protein coding gene expression and are thought to play a critical role in many biological processes. Aberrant levels of miRNAs have been associated with numerous diseases and cancers, and as such, miRNAs have gain much interests as diagnostic biomarkers, and as therapeutic targets. However, their role in autoimmunity is largely unknown. The aims of this study are to: (1) identify differentially expressed miRNAs in human primary biliary cirrhosis (PBC); (2) validate these independently; and (3) indentify potential targets of differentially expressed miRNAs. We compared the expression of 377 miRNAs in explanted livers form subjects with PBC versus controls with normal liver histology. A total of 35 independent miRNAs were found to be differentially expressed in PBC (p< 0.001). Quantitative PCR was employed to validate down-regulation of microRNA-122a (miR-122a) and miR-26a and the increased expression of miR-328 and miR-299-5p. The predicted targets of these miRNAs are known to affect cell proliferation, apoptosis, inflammation, oxidative stress, and metabolism. Our data are the first to demonstrate that PBC is characterized by altered expression of hepatic miRNA; however additional studies are required to demonstrate a causal link between those miRNA and the development of PBC.
Keywords: autoimmune liver diseases, microRNA, primary biliary cirrhosis
1. Introduction
MicroRNAs (miRNAs) have emerged as among one of the key regulatory molecules of pronounced physiological importance in health and disease. miRNAs belong to a class of small, non-coding RNA molecules that control protein expression at the post-transcriptional level [1, 2]. Their mechanism of action involves imperfect binding to complementary sequences in the 3′ untranslated region (3′UTR) of target messenger RNA (mRNA), leading to either cleavage of the mRNA [3] or repression of protein translation [4]. A single miRNA is thought to regulate hundreds of protein coding genes, and consequently, play an intricate role in the regulation of a number of cellular processes, which include metabolism, immune function, cell proliferation, apoptosis, tissue development and differentiation [5-8]. Changes in the relative levels of miRNA expression have been associated with a number of diseases, including cancer, cardiovascular disease and neuro-pathologies [9-13]. While dysregulated miRNAs have been shown to play a role in systemic autoimmune disorders [14, 15], their contribution to influence the induction and/or maintenance of organ-specific autoimmune diseases remain unknown.
Primary biliary cirrhosis (PBC) is a female predominant, progressive autoimmune disease of the liver, characterized by the selective destruction of small intrahepatic bile ducts [16]. The serological hallmark of PBC is the presence of high titer anti-mitochondrial auto-antibodies (AMA) directed against several protein complexes located in the inner mitochondrial membrane [17]. The principal auto-antigen is the E2 subunit of the pyruvate dehydrogenase enzyme complex (PDC-E2) [18]. Auto-reactive T cells against PDC-E2 are also found in AMA negative patients [19]. Histological characteristics of the disease include fibrotic lesions, extensive lymphocyte infiltration in portal tracts, and selective destruction of intrahepatic bile ducts culminating in cirrhosis and eventual liver failure [16]. During the past two decades extensive efforts have been made to dissect the immunology, molecular biology, epidemiology and genetics of PBC [20, 21]; yet the molecular mechanism and etiology of this enigmatic autoimmune disease remain in part unknown. We hypothesize that differentially expressed miRNAs can help delineate a possible molecular mechanism for the disease.
In this study we have generated a global miRNA expression profile from the liver of patients with PBC, with the aim of identifying potential dysegulated miRNAs and their prospective gene targets.
2. Materials and Methods
2.1. Tissue samples
Explanted liver tissue from six patients with end stage PBC and five normal controls were obtained from multiple transplant centers through an NIH consortium on liver procurement. Tissues were flash frozen after surgery and kept frozen at -80°C for long-term storage. Detailed backgrounds for each tissue donor, including age, sex, clinical staging, survival time from diagnosis and therapy have been collected. The diagnosis of all cases was based on international established criteria [16].
2.2. RNA purification and miRNA isolation
Frozen liver tissue was incubated overnight at -20°C in RNAlater®-ICE (Ambion, Austin, TX) before RNA isolation commenced. 25 to 100 mg of equilibrated liver tissue was homogenized in 1 ml TriReagent® (Molecular Research Center, Inc, Cincinnati, OH) and total RNA was isolated according to the manufacturer's protocol. The RNA was precipitated with 1 volume isopropanol for 1hr at -20°C and then re-precipitated with 3 volumes of 100% ethanol overnight at -20°C. The precipitated RNA was then re-suspended in TE pH 7.0 (10 mM Tris, 0.5 mM EDTA). The RNA concentration and purity were measured by Nanodrop. The quality of the total liver RNA was analyzed on a 15% denaturing acrylamide gel (Invitrogen, Carlsbad, CA) before isolating miRNA from each sample. The miRNA portion was separated from 10 μg of total RNA by flashPAGE™ (Ambion) gel fractionation.
2.3. miRNA arrays
All purified miRNA fractions were quantified using a PicoRNA chip on a Bioanalyzer microfluidics system (Agilent, Santa Clara, CA), labeled with AlexaFluor® 555 (Invitrogen) fluorescent dye according to the mirVana™ miRNA labeling kit (Ambion) and hybridized to mirVana™ miRNA bioarray slide vs.1 (Ambion) according to the protocol supplied by the manufacturer. Hybridization and washes were performed with solutions from the mirVana miRNA Bioarray Essential Kit (Ambion), Labeled probes were evaporated in a vacuum centrifuge on aqueous setting at 60° C to a volume of approximately 2-3 ul. Evaporated probes were then re-suspended in 100 ul of a salt based hybridization solution (Ocimum Biosolutions, Indianapolis, IN). All labeling, hybridization, and scanning steps were performed in a hepa and carbon filtered clean room at the UC Davis ArrayCore Microarry facility (http://array.ucdavis.edu). Hybridization occurred on a Tecan HS 4800 automated hybridization station. A pre-hybridization solution (5X SSPE/6M Urea/0.5% Tween-20/10X Denhardt's) was applied to the slides at 50°C and agitated for 15 minutes on the medium setting. Labeled probes were then injected after denaturing for three minutes on a 95° C heat block (probes were quickly mixed via vortex, spun down at 14,000 rpm and allowed to cool to room temperature before injection). All steps with the fluorescently labeled probes were performed in the dark. Hybridization occurred for 16 hours at 50° C at a medium agitation frequency. Following hybridization, slides were soaked for 15 seconds with the pre-hybridization buffer followed by a 15 second wash with pre-hybridization buffer at 50° C. Slides were then consecutively washed at 37° C with three Ambion salt based buffers of increasing stringency. Each buffer wash step was repeated twice with a soak time of one minute followed by an agitated wash of one minute, for a total of six washes. A final water wash step was performed at 37° C with a soak time of one minute followed by a one minute wash. Following the final wash slides were dried under a constant stream of N2 at 30° C. Each mirVana miRNA array slide was printed with two identical arrays that were used as technical replicates. The hybridized miRNA array slides were scanned using an Axon GenePix 4000B microarray scanner (Molecular Devices, Sunnyvale, CA) at 100% laser power, with a photomultiplier tube (PMT) setting of 600nm at 5μm resolution for Alexa 555 (Invitrogen) labeled probes. Image files were quantified using the GenePix Pro 4.0 software (Molecular Devices), which produces output files of raw image intensities for each array.
2.4. Real-time PCR validation
cDNA was synthesized from total RNA using the TaqMan MicroRNA Reverse Transcription Kit (Applied Biosystems, Foster City, CA). 10 ng of total RNA from each sample was reverse transcribed (RT) with a miRNA-specific stem-loop primer supplied in the TaqMan MicroRNA Assay kit (ABI) following the manufacturer's protocol. The RT products were diluted 6-fold in nuclease-free water. The real-time PCR reactions were performed in a final volume of 10 μl, containing 4 μl of diluted RT template, 0.5 μl nuclease free water, 0.5 μl of 20× primer/probe mix from the TaqMan MicroRNA Assay kit (Applied Biosystems) and 5 μl of 2× TaqMan Universal PCR master mix (no AmpErase UNG, Applied Biosystems). All reactions were run in duplicates on an Applied Biosystems 7900 HT Sequence Detection System (Applied Biosystems, Foster City, CA) using a 384-well optical plate format. After an initial 10 min enzyme activation step at 95°C, the PCR parameters were set for 40 cycles at 95°C for 15 s and 60°C for 1 min in the 9600 emulation mode.
2.5. Statistical analysis
Raw expression data from the single-color miRNA microarrays were loaded into the linear models for microarray (limma) [22] package of Bioconductor in R, an open-source statistical programming environment (www.bioconductor.org) for comprehensive analysis of microarray and genomics data. Background was corrected using the subtraction method in R, and between-array normalization was achieved by limma's quantile normalization of mean probe intensity values (Aquantile method) [23]. Duplicates of normalized and log2-transformed miRNA expression data were averaged and imported into Cluster 3.0 running on a UNIX workstation [24, 25]. Data were centered to the mean of each miRNA and unsupervised centroid linkage hierarchical clustering (HC) of both the miRNAs and samples was then performed using uncentered correlation metrics. To fold the branches of the dendrograms, HC was followed by self-organizing maps using Eucledian distance similarity metrics. Dendrograms and miRNA expression data were visualized in Java TreeView [26].
As for the RT-PCR results, the instrument's default threshold settings were utilized to calculate the cycle thresholds (CT) for each run. The comparativeCT method 2-ΔΔCT was used to calculate the changes in miRNA expression of all samples relative to a non-diseased liver RNA sample which was designated as the calibrator [27, 28]. Assay normalization was performed with constitutively expressed small RNA molecule RNU-48 as the endogenous control. To determine the ΔCT we calculated the mean CT of the RNU-48 control and subtracted it from the mean CT of the target miRNA in each sample. The ΔΔCT was then calculated by subtracting the ΔCT of the calibrator from the ΔCT of the sample. The resulting values were compared with Mann Whitney U-test (Prism vs. 4).
2.6. miRNA target gene prediction
We used the TargetScan algorithm to identify predicted gene targets of our differentially expressed miRNAs. TargetScan was mainly selected because it predicted the highest number of known miRNA targets obtained from TarBase 5.0 (http://microrna.gr/tarbase) in our subset of differentially expressed miRNAs [29]. Additionally, Targetscan considers the importance of multiple copies of miRNA target sites on the 3′ UTR of the gene in question [30]. We narrowed down the results by categorizing target genes into biological processes using Gene Ontology (GO) classifications for comparison. The number of potentially up-regulated genes (target genes of down-regulated miRNAs) was compared to potentially down-regulated genes (target genes of up-regulated miRNAs) that belonged to the same GO biological process. A score reflecting the magnitude of the difference between representation by up-regulated and down-regulated genes was calculated by the following equation: [(number of up-regulated genes in process) – (number of down-regulated genes in process)] / (the lesser of the number of up-regulated or down-regulated genes or ‘1’ if the lesser of the two is zero). The open source bioinformatics software platform Cytoscape (www.cytoscape.org) was used to visualize the scores [31]. GO annotations and p-values for biological processes were assigned to target genes using BiNGO 2.3 [32], a plugin for Cytoscape, as well as the Database for Annotation, Visualization and Integrated Discovery (DAVID) [33]. BiNGO was also used to generate the GO biological process network and the Cerebral plugin was used for expression visualization and layout [34]. The hypergeometric test was selected for BiNGO's statistical testing, and the Benjamini-Hochberg False Discovery Rate method was used for the multiple testing corrections [35]. The EASE score, a modified Fisher Exact P-Value, was used for statistical biological process pathway analysis and the Benjamini-Hochberg method was used for multiple testing corrections [36].
3. Results
3.1 miRNA expression profile in subjects affected of PBC
We analyzed liver tissues from 6 patients diagnosed with end-stage PBC and 5 non-diseased control subjects, using a miRNA array platform that sampled 377 human, mouse and rat miRNAs (mirVana Bioarray vs 1, Ambion). A total of 35 independent microRNAs were found to be differentially expressed in PBC as compared with normal controls (p< 0.001, the false discovery rate (FDR) was kept to a maximum of 5%; Table 1). These are shown visually in the cluster analysis (Figure 1). While 11 miRNAs were significantly up-regulated in PBC patients with miR-145 being the most enriched (> 2-fold), relative levels of 24 dysregulated miRNAs were down-regulated.
Table 1.
Differentially expressed miRNAs in livers from PBC patients (n=6) compared with normal controls (n=5)
| miRNA | Expression | Fold Change | p-value | q-value (%) |
|---|---|---|---|---|
| mmu-miR-346 | Up | 2.21 | 3.0e-05 | 5 |
| hsa-miR-145_MM2 | Up | 2.03 | 4.7e-07 | 5 |
| hsa-miR-328 | Up | 1.89 | 1.7e-04 | 5 |
| hsa-miR-371 | Up | 1.83 | 6.7e-05 | 5 |
| hsa-miR-299_5p | Up | 1.74 | 1.0e-05 | 5 |
| hsa-miR-374 | Up | 1.69 | 3.8e-04 | 5 |
| hsa-miR-506 | Up | 1.65 | 9.9e-06 | 5 |
| hsa-miR-202_AS | Up | 1.63 | 5.5e-05 | 5 |
| hsa-miR-186 | Up | 1.60 | 8.1e-05 | 5 |
| mmu-miR-341 | Up | 1.43 | 9.4e-05 | 5 |
| hsa-miR-25 | Up | 1.37 | 1.5e-04 | 5 |
| hsa-miR-122a | Down | 0.05 | 1.3e-06 | 0 |
| hsa-miR-23b | Down | 0.15 | 2.1e-03 | 4 |
| hsa-miR-26a | Down | 0.23 | 7.1e-04 | 4 |
| hsa-miR-192 | Down | 0.31 | 1.4e-04 | 4 |
| hsa-miR_126 | Down | 0.32 | 4.7e-07 | 0 |
| hsa_miR-130b | Down | 0.32 | 6.0e-05 | 4 |
| mmu-miR-192 | Down | 0.33 | 8.2e-06 | 0 |
| hsa-miR-194 | Down | 0.36 | 1.7e-04 | 4 |
| hsa-miR-24 | Down | 0.38 | 3.2e-06 | 0 |
| hsa-miR-107 | Down | 0.42 | 4.0e-04 | 4 |
| hsa-miR-455-3p | Down | 0.42 | 2.7e-06 | 4 |
| hsa-miR-16 | Down | 0.47 | 2.7e-04 | 4 |
| hsa-miR-193b | Down | 0.48 | 6.0e-05 | 0 |
| hsa-miR-103 | Down | 0.48 | 4.8e-04 | 4 |
| hsa-miR-100 | Down | 0.49 | 1.7e-04 | 4 |
| hsa-miR-27b | Down | 0.50 | 4.0e-04 | 4 |
| hsa-miR-19b | Down | 0.51 | 1.6e-04 | 4 |
| hsa_let_7d | Down | 0.54 | 5.8e-04 | 4 |
| hsa_miR-99a | Down | 0.55 | 2.3e-04 | 4 |
| hsa-miR-30c | Down | 0.63 | 4.9e-06 | 0 |
| hsa_miR-422b | Down | 0.63 | 1.4e-04 | 4 |
| hsa_miR-30e-5p | Down | 0.64 | 6.7e-04 | 4 |
| hsa-miR-92 | Down | 0.68 | 3.0e-04 | 4 |
| mmu-miR-101b | Down | 0.71 | 1.6e-04 | 4 |
Figure 1. Heat map and hierarchical clustering.
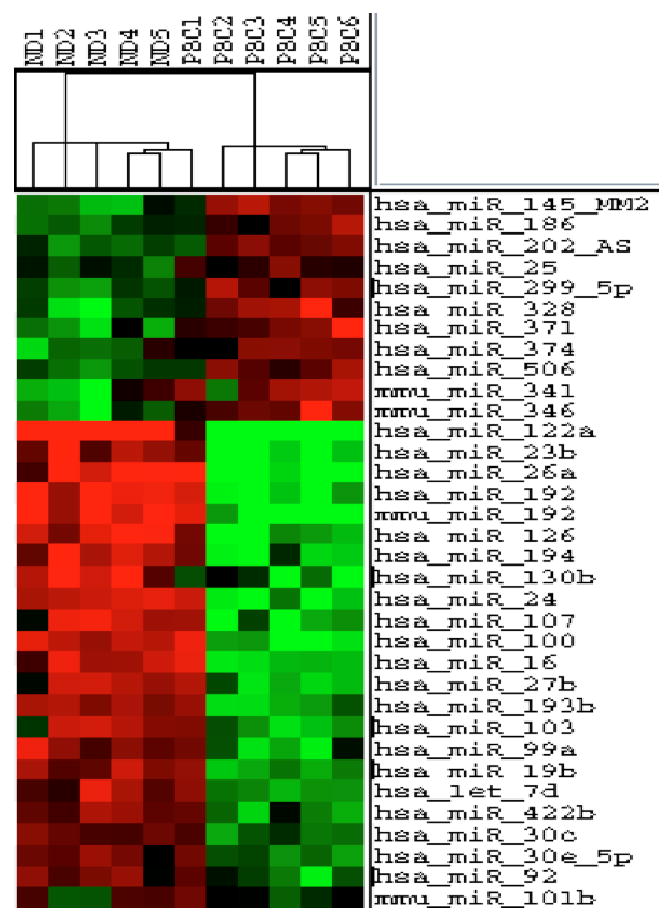
Individual miRNA expression values were calculated as described in Materials & Methods. Duplicates of log2-transformed values of each spot were averaged and imported into Cluster 3.0. Hierarchical clustering and self-organizing maps were computed using the parameters described in Materials & Methods. Dendrograms and log2-transformed miRNA expression values were visualized using Java Treeview. miRNAs are presented that were significantly differentially regulated using a maximum false discovery rate of 5%.
The unsupervised classification of the HC and self-organizing maps (SOM) showed separation of the diseased and control groups (Figure 1). None of the miRNA profiles from normal subjects clustered with that of PBC patients and only one out of six PBC subject clustered with the normal samples. On the other hand, SOM identified the miRNA expression pattern of this PBC subject to most resemble that of the PBC group. Variations in the profiles between subjects within the same group were less than the differences between the profiles of PBC patients and normal controls. The miRNA profiles of samples from subjects within each category did not seem to cluster into subcategories.
3.2 miRNA validation study
We used real-time PCR (RT-PCR) as a confirmatory method to verify the data obtained from the microarray analysis. The relative expression levels from 6 of the 36 differentially expressed miRNAs (Table 2) were analyzed with the TaqMan microRNA assay (Applied Biosystems, Foster City, CA). We chose 3 primer/probe sets that represent up-regulated miRNAs (hsa-miR-299-5p, hsa-miR-328, and hsa-miR-371) and 3 that represent down-regulated miRNA (hsa-miR-26a, hsa-miR-122a, and hsa-miR-99a). The amplification efficiency for each primer/probe set was determined by generating a standard curve obtained using a 10-fold dilution series of reverse-transcribed miRNA (data not shown). Only the primer/probe set specific for hsa-miR-371 showed inconsistent amplification results and was therefore not included in our validation study. In addition to the samples used in the miRNA microarray experiment, we included supplemental RNA samples isolated from liver tissue of patients with PBC and non-diseased controls. We reasoned that analyzing the miRNA expression of additional samples for both experimental groups would allow us to determine if the miRNA microarray profile was sustained by a separate method when the sample size was increased. Because the TaqMan assay we employed is based on RT-PCR with an independent reverse transcription step for generating the specific miRNA, the input template had to be normalized to a constitutively expressed endogenous control. For this purpose we tested control primer/probe pairs (RNU-44, RNU-48 and RNU-19) to determine which of these would be most consistently expressed in human liver tissue. All CT values were normalized to the small, endogenous RNA species RNU-48 before being compared to a calibrator sample.
Table 2.
Validation of miRNA microarray data by RT-PCR
| miRNA | Microarray expression profile | TaqMan expression profile | TaqMan p-value |
|---|---|---|---|
| hsa-miR-26a | down | down | 0.0317 |
| hsa-miR-122a | down | down | 0.0010 |
| hsa-miR-99a | down | down | 0.1119 |
| hsa-miR-299-5p | up | up | 1.0000 |
| hsa-miR-328 | up | up | 0.0070 |
| hsa-miR-371 | up | n/a | n/a |
The results obtained using the RT-PCR assays confirmed the data obtained from the initial microarray screen (Figure 2). Three of the five miRNAs validated with the TaqMan assay were significantly different in the liver of patients with stage 4 PBC than in normal controls. Although expression levels of hsa-miR-299-5p and hsa-miR-99a could not be statistically validated, the overall trend of their expression profile recapitulated the results from the microarray experiment (Table 1).
Figure 2. Validation of microarray results for selected miRNAs.
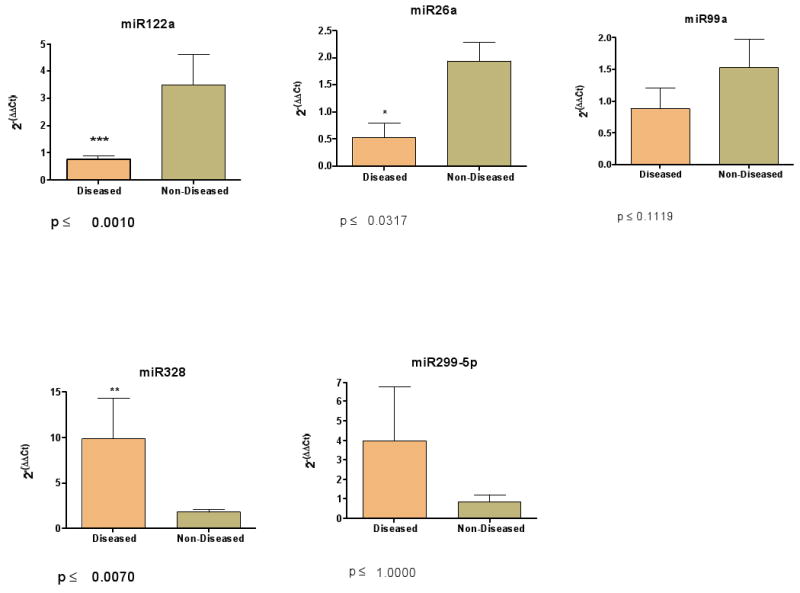
Real time threshold cycle values for each miRNA primer/probe set were normalized with RNU-48 primer/probe pair and compared to a calibrator [28]. The final values were imported into the statistical software Prism (version 4) and analyzed with the Mann Whitney U test. The results of the RT-PCR validation study correlate with the results generated with the microarrays
3.3 miRNA target genes
To determine possible target genes for the differentially expressed miRNAs we searched the TargetScan 4.2 (http://www.targetscan.org) database for predicted miRNA targets in mammals. TargetScan successfully predicted 13 experimentally confirmed gene targets of miRNAs examined in our study, which were provided by TarBase, while Pictar predicted 11 and Miranda 8. A total of 2152 genes were predicted as targets for 22 down-regulated miRNAs, while 1905 genes were predicted for 9 up-regulated miRNAs. These genes were submitted to Cytoscape for visualization and BiNGO, a Cytoscape plugin, was used for GO biological process categorization and network generation [31, 32]. A score reflecting the relative difference in the number of up or down-regulated genes found in each biological process was calculated as described in the Materials and Methods section. Figure 3 illustrates the overall Cytoscape representation of biological processes relatively dominated by up-regulated (red) or down-regulated (blue) target genes as determined by the calculated scores. The top 20 processes targeted by these genes are listed in Table 3 and Table 4, respectively. Over-representation of GO biological processes by up or down-regulated genes as determined by BiNGO or DAVID are depicted in Table 5 and Table 6, respectively.
Figure 3. Multiplicity and cooperativity in miRNA-target gene interactions.
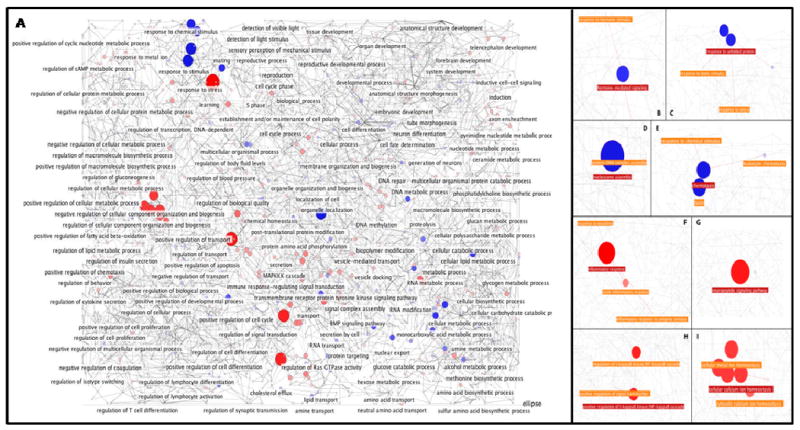
Visualization of down-regulated and up-regulated Cytoscape pathways Gene Ontology biological process pathways were generated with the BiNGO plug-in in Cytoscape. Relative gene expressions are depicted by the size and colors of the nodes. Red nodes depict processes that are targeted mainly by up-regulated genes while blue represents that of down-regulated genes. A) Overview of biological processes. B-I) Selected highlighted process pathways
Table 3.
GO biological processes composed of mainly up-regulated genes
| Gene Ontology Biological Process | Number (%) of genes targeted by down-regulated miRNAs | Number (%) of genes targeted by up-regulated miRNAs |
|---|---|---|
| inflammatory response | 15 (5.58%) | 0 |
| neuropeptide signaling pathway | 13 (13.83%) | 0 |
| positive regulation of I-kappaB kinase/NF-kappaB cascade | 12 (13.04%) | |
| regulation of I-kappaB kinase/NF-kappaB cascade | 12 (12.12%) | 0 |
| cellular calcium ion homeostasis | 10 (9.01%) | 0 |
| calcium ion homeostasis | 10 (8.93%) | 0 |
| cellular metal ion homeostasis | 10 (8.47%) | 0 |
| metal ion homeostasis | 10 (8.40%) | 0 |
| cytokine and chemokine mediated signaling pathway | 6 (15.00%) | 0 |
| RNA elongation from RNA polymerase II promoter | 6 (12.77%) | 0 |
| RNA elongation | 6 (12.00%) | 0 |
| cytosolic calcium ion homeostasis | 6 (9.23%) | 0 |
| elevation of cytosolic calcium ion concentration | 6 (9.23%) | 0 |
| G-protein signaling, coupled to IP3 second messenger (phospholipase C activating) | 7 (9.33%) | 1 (1.33%) |
| proton transport | 6 (9.09%) | 0 |
| negative regulation of hormone secretion | 6 (46.15%) | 1 (7.69%) |
| protein polyubiquitination | 5 (38.46%) | 0 |
| peptidyl-tyrosine phosphorylation | 5 (29.41%) | 0 |
| peptide transport | 5 (18.52%) | 0 |
| positive regulation of transcription factor activity | 5 (15.63%) | 0 |
| positive regulation of DNA binding | 5 (14.71%) | 0 |
Percentages represent the fraction of the total number of genes belonging to the specific GO biological process.
Table 4.
GO biological processes composed of mainly down-regulated genes
| Gene Ontology Biological Process | Number (%) of genes targeted by down-regulated miRNAs | Number (%) of genes targeted by up-regulated miRNAs |
|---|---|---|
| nucleosome assembly | 0 | 11 (10.48%) |
| taxis | 0 | 11 (7.75%) |
| chemotaxis | 0 | 11 (7.75%) |
| response to protein stimulus | 0 | 9 (15.00%) |
| response to unfolded protein | 0 | 9 (15.00%) |
| hormone-mediated signaling | 0 | 7 (18.92%) |
| nuclear-transcribed mRNA catabolic process | 0 | 6 (25.00%) |
| mRNA catabolic process | 0 | 6 (20.69%) |
| RNA catabolic process | 0 | 6 (13.33%) |
| nuclear-transcribed mRNA catabolic process, nonsense-mediated decay | 0 | 5 (23.81%) |
| mRNA export from nucleus | 0 | 5 (21.74%) |
| RNA export from nucleus | 0 | 5 (17.24%) |
| transmembrane transport | 0 | 5 (12.82%) |
| T cell activation | 0 | 5 (9.09%) |
| cell cycle checkpoint | 0 | 5 (8.62%) |
| ncRNA processing | 0 | 5 (3.38%) |
| phenol metabolic process | 0 | 4 (18.18%) |
| regulation of cell-cell adhesion | 0 | 4 (18.18%) |
| catecholamine metabolic process | 0 | 4 (19.05%) |
| translational initiation | 0 | 4 (17.39%) |
| hemostasis | 0 | 4 (4.60%) |
| regulation of developmental growth | 1 (20.00%) | 4 (80.00%) |
| intracellular lipid transport | 0 | 3 (42.86%) |
| protein heterooligomerization | 0 | 3 (37.50%) |
| cofactor transport | 0 | 3 (21.43%) |
| protein secretion | 0 | 3 (17.65%) |
| germ cell development | 0 | 3 (16.67%) |
| protein amino acid ADP-ribosylation | 0 | 3 (15.79%) |
| sterol transport | 0 | 3 (14.29%) |
| calcium-independent cell-cell adhesion | 0 | 3 (14.29%) |
| cholesterol transport | 0 | 3 (14.29%) |
Percentages represent the fraction of the total number of genes belonging to the specific GO biological process.
Table 5.
Over-represented down and up-regulated biological pathways by BiNGO
| GO Biological Process | Process p-value of genes targeted by down-regulated miRNAs | Process p-value of genes targeted by up-regulated miRNAs | Number of miRNAs in process |
|---|---|---|---|
| Up-regulated processes | |||
| mitotic cell cycle | 0.0004 | 0.6626 | 20 |
| regulation of peptidyl-serine phosphorylation | 0.0008 | 0.4203 | 8 |
| positive regulation of | |||
| peptidyl-serine | 0.0008 | 0.4203 | 8 |
| phosphorylation | |||
| protein autoprocessing | 0.0002 | 0.3762 | 20 |
| protein amino acid autophosphorylation | 0.0001 | 0.3380 | 20 |
| cellular protein metabolic process | 0.0006 | 0.3150 | 22 |
| Down-regulated processes | |||
| regulation of developmental growth | 0.4609 | 0.0005 | 2 |
| regulation of BMP signaling pathway | 0.4564 | 0.0011 | 4 |
| negative regulation of BMP signaling pathway | 0.3270 | 0.0019 | 4 |
| homophilic cell adhesion | 0.3150 | 0.0030 | 7 |
| nucleobase, nucleoside, | |||
| nucleotide and nucleic acid | 0.2333 | 0.0007 | 8 |
| transport | |||
| endocrine pancreas development | 0.1912 | 0.0031 | 6 |
Table 6.
Over-represented down and up-regulated biological pathways by DAVID
| GO Biological Process | Process p-value of genes targeted by down-regulated miRNAs | Process p-value of genes targeted by up-regulated miRNAs | Number of miRNAs in process |
|---|---|---|---|
| Up-regulated processes | |||
| positive regulation of | |||
| small GTPase mediated | 0.0070 | 1.0000 | 8 |
| signal transduction | |||
| nucleosome disassembly | 0.0204 | 1.0000 | 7 |
| chromatin disassembly | 0.0204 | 1.0000 | 7 |
| actin cytoskeleton reorganization | 0.0327 | 1.0000 | 12 |
| protein polyubiquitination | 0.0457 | 1.0000 | 11 |
| endosome organization and biogenesis | 0.0482 | 1.0000 | 5 |
| Down-regulated processes | |||
| protein amino acid sulfation | 1.0000 | 0.0340 | 3 |
| positive regulation of ossification | 1.0000 | 0.0340 | 4 |
| sulfation | 1.0000 | 0.0340 | 3 |
| positive regulation of bone remodeling | 1.0000 | 0.0474 | 4 |
| negative regulation of angiogenesis | 1.0000 | 0.8525 | 3 |
| meiotic cell cycle | 0.8794 | 0.0268 | 7 |
4. Discussion
Given their ability to dampen the expression of multiple target genes, miRNAs are believed to play a crucial role in the regulation of many biological processes. Their altered expression has been implicated in the induction of disease or alteration disease states [1, 2]. In recent years the majority of miRNA studies have focused on elucidating their regulatory roles in cancer [37, 38]. In contrast, much less is known about how these regulatory molecules may impact autoimmune diseases. The current study provides the first evidence that PBC is associated with altered hepatic miRNA expression. We have demonstrated that a number of miRNAs were significantly differentially expressed in patients at the terminal stages of PBC, leading to a unique miRNA expression profile in the diseased liver.
To determine if any of these differentially expressed miRNAs could lead to a better understanding of the underlying molecular mechanism that perpetuates PBC, we searched for gene targets that may be affected by this particular miRNA expression signature. Of the several target prediction algorithms developed, we selected TargetScan based on its consideration of the conservation of target sites across several species, the number of target sites within the gene per miRNA, as well as experimentally confirmed targets predicted. There has been evidence that multiple seed regions positioned within a limited range in the 3′ UTR of a target gene improves miRNA function [30, 39]. Thus the fact that TargetScan takes seed region copy number into account is beneficial. Due to the sheer volume of targets predicted by TargetScan, genes were clustered into biological processes according to GO. These processes were then analyzed for the relative abundance of down versus up-regulated targeted genes. A visual representation of the abundance differences was achieved through Cytoscape using the BiNGO plugin to generate the GO biological process network. Additionally, we incorporated the plugin Cerebral for improved visualization and score expression display. Interestingly, biological processes dominated by up-regulated genes included those associated with inflammatory response, calcium ion homeostasis, and negative regulation of hormone secretion, all of which have been associated with PBC [40]. Using suppressive subtractive hybridization and virtual subtraction of independent cDNA libraries from liver and biliary epithelial cells of patients with PBC, Tanaka and colleagues have reported a number of genes involved in signaling, RNA processing, mitochondrial function, inflammation, and fibrosis that are unique to PBC [41, 42]. For example, it is clear that PBC, as an autoimmune disease, has an inflammatory component in association with loss of bone mass [43] as well as a clear female pre-dominance [44, 45]. Moreover, the role of apoptosis in autoimmune development and specifically in PBC cannot be forgotten [46, 47].
Our observations may help seal several remaining gaps in the understanding of induction and perpetuation of PBC albeit some limits must be faced. First, biological processes that are statistically over-represented by up-regulated genes include the mitotic cell cycle, which may reflect the increased number of inflammatory infiltrates and fibrotic growth in PBC livers. On the other hand, down-regulated processes such as sulfation have been demonstrated to affect autoimmunity [48]. However, all these processes can be a consequence of the chronic autoimmune inflammation and may not be specific for PBC. Of particular interest is the massive down-regulation of the liver-specific miR-122a, which normally accounts for about 70% of the total miRNA population found in the liver [49, 50] and has been associated with liver cancer and NASH [51, 52]. Indeed, conformation of the involvement of these pathways would require determining the inverse relationship between miRNA and their target protein levels in patient livers, as well as direct evidence of miRNA interaction with their cognate targets. Secondly, differences in the miRNA expression pattern could be secondary to the development of cirrhosis, characteristics of the patients studied herein. Nevertheless, none of the dysregulated miRNAs reported in our study, with the exception of miR-122a, have been associated with other hepatic diseases nor cirrhosis [51]. However, as stated above, since liver tissues used for analysis consisted of samples from patients with end stage PBC disease, it is likely that the cellular composition of the tissues from the patients as compared with normal controls is distinct. As such, the differences noted could be a reflection of the variation in the relative composition of the cell lineages being studied. These studies were designed as an initial exploratory investigation to identify major changes in the expression of miRNAs in PBC patients. Thus, it is clear that more definitive studies utilizing specific lineages of liver tissue cells at different disease stages need to be examined for their differential expression of miRNAs which may provide more insights into the role of miRNAs in the pathology of PBC.
In conclusion, our data supports the view that PBC is characterized by altered expression of hepatic miRNAs. By revealing the differentially expressed miRNAs in PBC, we are beginning to understand the molecular circuitry important for the development and pathogenesis of this autoimmune liver disease.
Acknowledgments
This work was supported by National Institutes of Health Grant DK 39588 and NCMHD/NIH P60/MD00222.
Abbreviations
- miRNAs
microRNAs
- 3′UTR
3′ untranslated region
- PBC
primary biliary cirrhosis
- AMA
antimitochondrial antibodies
- PDC-E2
E2 subunit of the pyruvate dehydrogenase enzyme complex
- limma
linear models for microarray
- CT
cycle thresholds
- ΔCT
delta CT
- GO
Gene Ontology
- DAVID
Database for Annotation Visualization and Integrated Discovery
- FDR
false discovery rate
- HC
hierarchical clustering
- SOM
self-organizing maps
- RT
reverse transcription
- RT-PCR
real-time PCR
Footnotes
Publisher's Disclaimer: This is a PDF file of an unedited manuscript that has been accepted for publication. As a service to our customers we are providing this early version of the manuscript. The manuscript will undergo copyediting, typesetting, and review of the resulting proof before it is published in its final citable form. Please note that during the production process errors may be discovered which could affect the content, and all legal disclaimers that apply to the journal pertain.
References
- 1.Ambros V. The functions of animal microRNAs. Nature. 2004;431:350–5. doi: 10.1038/nature02871. [DOI] [PubMed] [Google Scholar]
- 2.Nilsen TW. Mechanisms of microRNA-mediated gene regulation in animal cells. Trends Genet. 2007;23:243–9. doi: 10.1016/j.tig.2007.02.011. [DOI] [PubMed] [Google Scholar]
- 3.Yekta S, Tabin CJ, Bartel DP. MicroRNAs in the Hox network: an apparent link to posterior prevalence. Nat Rev Genet. 2008;9:789–96. doi: 10.1038/nrg2400. [DOI] [PMC free article] [PubMed] [Google Scholar]
- 4.Pillai RS, Bhattacharyya SN, Artus CG, Zoller T, Cougot N, Basyuk E, Bertrand E, Filipowicz W. Inhibition of translational initiation by Let-7 MicroRNA in human cells. Science. 2005;309:1573–6. doi: 10.1126/science.1115079. [DOI] [PubMed] [Google Scholar]
- 5.Alvarez-Garcia I, Miska EA. MicroRNA functions in animal development and human disease. Development (Cambridge, England) 2005;132:4653–62. doi: 10.1242/dev.02073. [DOI] [PubMed] [Google Scholar]
- 6.Baltimore D, Boldin MP, O'Connell RM, Rao DS, Taganov KD. MicroRNAs: new regulators of immune cell development and function. Nat Immunol. 2008;9:839–45. doi: 10.1038/ni.f.209. [DOI] [PubMed] [Google Scholar]
- 7.Check Hayden E. Thousands of proteins affected by miRNAs. Nature. 2008;454:562. doi: 10.1038/454562b. [DOI] [PubMed] [Google Scholar]
- 8.Faber J, Gregory RI, Armstrong SA. Linking miRNA regulation to BCR-ABL expression: the next dimension. Cancer Cell. 2008;13:467–9. doi: 10.1016/j.ccr.2008.05.013. [DOI] [PubMed] [Google Scholar]
- 9.Johnson R, Zuccato C, Belyaev ND, Guest DJ, Cattaneo E, Buckley NJ. A microRNA-based gene dysregulation pathway in Huntington's disease. Neurobiol Dis. 2008;29:438–45. doi: 10.1016/j.nbd.2007.11.001. [DOI] [PubMed] [Google Scholar]
- 10.van Rooij E, Sutherland LB, Thatcher JE, DiMaio JM, Naseem RH, Marshall WS, Hill JA, Olson EN. Dysregulation of microRNAs after myocardial infarction reveals a role of miR-29 in cardiac fibrosis. Proc Natl Acad Sci U S A. 2008;105:13027–32. doi: 10.1073/pnas.0805038105. [DOI] [PMC free article] [PubMed] [Google Scholar]
- 11.Wang CH, Lee DY, Deng Z, Jeyapalan Z, Lee SC, Kahai S, Lu WY, Zhang Y, Yang BB. MicroRNA miR-328 regulates zonation morphogenesis by targeting CD44 expression. PLoS ONE. 2008;3:e2420. doi: 10.1371/journal.pone.0002420. [DOI] [PMC free article] [PubMed] [Google Scholar]
- 12.Bruchova H, Merkerova M, Prchal JT. Aberrant expression of microRNA in polycythemia vera. Haematologica. 2008;93:1009–16. doi: 10.3324/haematol.12706. [DOI] [PubMed] [Google Scholar]
- 13.Zhang C. MicroRNAs: role in cardiovascular biology and disease. Clin Sci (Lond) 2008;114:699–706. doi: 10.1042/CS20070211. [DOI] [PubMed] [Google Scholar]
- 14.Dai Y, Huang YS, Tang M, Lv TY, Hu CX, Tan YH, Xu ZM, Yin YB. Microarray analysis of microRNA expression in peripheral blood cells of systemic lupus erythematosus patients. Lupus. 2007;16:939–46. doi: 10.1177/0961203307084158. [DOI] [PubMed] [Google Scholar]
- 15.Zhou X, Jeker LT, Fife BT, Zhu S, Anderson MS, McManus MT, Bluestone JA. Selective miRNA disruption in T reg cells leads to uncontrolled autoimmunity. J Exp Med. 2008;205:1983–91. doi: 10.1084/jem.20080707. [DOI] [PMC free article] [PubMed] [Google Scholar]
- 16.Kaplan MM, Gershwin ME. Primary biliary cirrhosis. N Engl J Med. 2005;353:1261–73. doi: 10.1056/NEJMra043898. [DOI] [PubMed] [Google Scholar]
- 17.Gershwin ME, Mackay IR, Sturgess A, Coppel RL. Identification and specificity of a cDNA encoding the 70 kd mitochondrial antigen recognized in primary biliary cirrhosis. J Immunol. 1987;138:3525–31. [PubMed] [Google Scholar]
- 18.Van de Water J, Gershwin ME, Leung P, Ansari A, Coppel RL. The autoepitope of the 74-kD mitochondrial autoantigen of primary biliary cirrhosis corresponds to the functional site of dihydrolipoamide acetyltransferase. J Exp Med. 1988;167:1791–9. doi: 10.1084/jem.167.6.1791. [DOI] [PMC free article] [PubMed] [Google Scholar]
- 19.Shimoda S, Miyakawa H, Nakamura M, Ishibashi H, Kikuchi K, Kita H, Niiro H, Arinobu Y, Ono N, Mackay IR, et al. CD4 T-cell autoreactivity to the mitochondrial autoantigen PDC-E2 in AMA-negative primary biliary cirrhosis. J Autoimmun. 2008;31:110–5. doi: 10.1016/j.jaut.2008.05.003. [DOI] [PubMed] [Google Scholar]
- 20.Gershwin ME, Mackay IR. The causes of primary biliary cirrhosis: Convenient and inconvenient truths. Hepatology. 2008;47:737–45. doi: 10.1002/hep.22042. [DOI] [PubMed] [Google Scholar]
- 21.Shoenfeld Y, Selmi C, Zimlichman E, Gershwin ME. The autoimmunologist: geoepidemiology, a new center of gravity, and prime time for autoimmunity. J Autoimmun. 2008;31:325–30. doi: 10.1016/j.jaut.2008.08.004. [DOI] [PubMed] [Google Scholar]
- 22.Smyth GK. Linear models and empirical bayes methods for assessing differential expression in microarray experiments. Stat Appl Genet Mol Biol. 2004;3(Article3) doi: 10.2202/1544-6115.1027. [DOI] [PubMed] [Google Scholar]
- 23.Thorne N, Y YH, editors. Normalization for Two-color cDNA Microarray Data. 2003. [Google Scholar]
- 24.Eisen MB, Brown PO. DNA arrays for analysis of gene expression. Methods Enzymol. 1999;303:179–205. doi: 10.1016/s0076-6879(99)03014-1. [DOI] [PubMed] [Google Scholar]
- 25.De Hoon MJ, Imoto S, Miyano S. Statistical analysis of a small set of time-ordered gene expression data using linear splines. Bioinformatics. 2002;18:1477–85. doi: 10.1093/bioinformatics/18.11.1477. [DOI] [PubMed] [Google Scholar]
- 26.Saldanha AJ. Java Treeview--extensible visualization of microarray data. Bioinformatics. 2004;20:3246–8. doi: 10.1093/bioinformatics/bth349. [DOI] [PubMed] [Google Scholar]
- 27.Winer J, Jung CK, Shackel I, Williams PM. Development and validation of real-time quantitative reverse transcriptase-polymerase chain reaction for monitoring gene expression in cardiac myocytes in vitro. Anal Biochem. 1999;270:41–9. doi: 10.1006/abio.1999.4085. [DOI] [PubMed] [Google Scholar]
- 28.Schmittgen TD, Lee EJ, Jiang J. High-throughput real-time PCR. Methods Mol Biol. 2008;429:89–98. doi: 10.1007/978-1-60327-040-3_7. [DOI] [PubMed] [Google Scholar]
- 29.Papadopoulos GL, R M, Simossis VA, Sethupathy P, Hatzigeorgiou AG. The database of experimentally supported targets: a functional update of TarBase. Nucleic Acids Res. 2008 doi: 10.1093/nar/gkn809. in press. [DOI] [PMC free article] [PubMed] [Google Scholar]
- 30.Li M, Marin-Muller C, Bharadwaj U, Chow KH, Yao Q, Chen C. MicroRNAs: Control and Loss of Control in Human Physiology and Disease. World J Surg. 2008 doi: 10.1007/s00268-008-9836-x. [DOI] [PMC free article] [PubMed] [Google Scholar]
- 31.Yeung N, C M, Kuchinsky A, Smoot ME, Bader GD. Exploring biological networks with Cytoscape software. Curr Protoc Bioinformatics. 2008;Chapter 8 doi: 10.1002/0471250953.bi0813s23. [DOI] [PubMed] [Google Scholar]
- 32.Maere S, Heymans K, Kuiper M. BiNGO: a Cytoscape plugin to assess overrepresentation of gene ontology categories in biological networks. Bioinformatics. 2005;21:3448–9. doi: 10.1093/bioinformatics/bti551. [DOI] [PubMed] [Google Scholar]
- 33.Dennis G, Jr, Sherman BT, Hosack DA, Yang J, Gao W, Lane HC, Lempicki RA. DAVID: Database for Annotation, Visualization, and Integrated Discovery. Genome Biol. 2003;4:P3. [PubMed] [Google Scholar]
- 34.Barsky A, Gardy JL, Hancock RE, Munzner T. Cerebral: a Cytoscape plugin for layout of and interaction with biological networks using subcellular localization annotation. Bioinformatics. 2007;23:1040–2. doi: 10.1093/bioinformatics/btm057. [DOI] [PubMed] [Google Scholar]
- 35.Benjamini Y, Drai D, Elmer G, Kafkafi N, Golani I. Controlling the false discovery rate in behavior genetics research. Behav Brain Res. 2001;125:279–84. doi: 10.1016/s0166-4328(01)00297-2. [DOI] [PubMed] [Google Scholar]
- 36.Hosack DA, Dennis G, Jr, Sherman BT, Lane HC, Lempicki RA. Identifying biological themes within lists of genes with EASE. Genome Biol. 2003;4:R70. doi: 10.1186/gb-2003-4-10-r70. [DOI] [PMC free article] [PubMed] [Google Scholar]
- 37.Lin CJ, Gong HY, Tseng HC, Wang WL, Wu JL. miR-122 targets an anti-apoptotic gene, Bcl-w, in human hepatocellular carcinoma cell lines. Biochem Biophys Res Commun. 2008;375:315–20. doi: 10.1016/j.bbrc.2008.07.154. [DOI] [PubMed] [Google Scholar]
- 38.Gramantieri L, Ferracin M, Fornari F, Veronese A, Sabbioni S, Liu CG, Calin GA, Giovannini C, Ferrazzi E, Grazi GL, et al. Cyclin G1 is a target of miR-122a, a microRNA frequently down-regulated in human hepatocellular carcinoma. Cancer Res. 2007;67:6092–9. doi: 10.1158/0008-5472.CAN-06-4607. [DOI] [PubMed] [Google Scholar]
- 39.Saetrom P, Heale BS, Snove O, Jr, Aagaard L, Alluin J, Rossi JJ. Distance constraints between microRNA target sites dictate efficacy and cooperativity. Nucleic Acids Res. 2007;35:2333–42. doi: 10.1093/nar/gkm133. [DOI] [PMC free article] [PubMed] [Google Scholar]
- 40.Lan RY LP, Ansari AA Coppel RL, Gershwin ME. Solving the primary biliary cirrhosis puzzle: The emerging image of immunopathology in primary biliary cirrhosis. Clinical and Applied Immunology Reviews. 2005;5:271–284. [Google Scholar]
- 41.Tanaka A, Leung PS, Kenny TP, Au-Young J, Prindiville T, Coppel RL, Ansari AA, Gershwin ME. Genomic analysis of differentially expressed genes in liver and biliary epithelial cells of patients with primary biliary cirrhosis. J Autoimmun. 2001;17:89–98. doi: 10.1006/jaut.2001.0522. [DOI] [PubMed] [Google Scholar]
- 42.Nakagome Y, Ueno Y, Kogure T, Fukushima K, Moritoki Y, Ridgway WM, Eric Gershwin M, Shimosegawa T. Autoimmune cholangitis in NOD.c3c4 mice is associated with cholangiocyte-specific Fas antigen deficiency. J Autoimmun. 2007;29:20–9. doi: 10.1016/j.jaut.2007.03.004. [DOI] [PubMed] [Google Scholar]
- 43.Zein CO, Jorgensen RA, Clarke B, Wenger DE, Keach JC, Angulo P, Lindor KD. Alendronate improves bone mineral density in primary biliary cirrhosis: a randomized placebo-controlled trial. Hepatology. 2005;42:762–71. doi: 10.1002/hep.20866. [DOI] [PubMed] [Google Scholar]
- 44.Lleo A, Battezzati PM, Selmi C, Gershwin ME, Podda M. Is autoimmunity a matter of sex? Autoimmun Rev. 2008;7:626–30. doi: 10.1016/j.autrev.2008.06.009. [DOI] [PubMed] [Google Scholar]
- 45.Gleicher N, Barad DH. Gender as risk factor for autoimmune diseases. J Autoimmun. 2007;28:1–6. doi: 10.1016/j.jaut.2006.12.004. [DOI] [PubMed] [Google Scholar]
- 46.Lleo A, Selmi C, Invernizzi P, Podda M, Gershwin ME. The consequences of apoptosis in autoimmunity. J Autoimmun. 2008;31:257–62. doi: 10.1016/j.jaut.2008.04.009. [DOI] [PMC free article] [PubMed] [Google Scholar]
- 47.Mackay IR, Leskovsek NV, Rose NR. Cell damage and autoimmunity: a critical appraisal. J Autoimmun. 2008;30:5–11. doi: 10.1016/j.jaut.2007.11.009. [DOI] [PMC free article] [PubMed] [Google Scholar]
- 48.Hsu W, Rosenquist GL, Ansari AA, Gershwin ME. Autoimmunity and tyrosine sulfation. Autoimmun Rev. 2005;4:429–35. doi: 10.1016/j.autrev.2005.03.004. [DOI] [PubMed] [Google Scholar]
- 49.Lagos-Quintana M, Rauhut R, Yalcin A, Meyer J, Lendeckel W, Tuschl T. Identification of tissue-specific microRNAs from mouse. Curr Biol. 2002;12:735–9. doi: 10.1016/s0960-9822(02)00809-6. [DOI] [PubMed] [Google Scholar]
- 50.Sempere LF, Freemantle S, Pitha-Rowe I, Moss E, Dmitrovsky E, Ambros V. Expression profiling of mammalian microRNAs uncovers a subset of brain-expressed microRNAs with possible roles in murine and human neuronal differentiation. Genome Biol. 2004;5:R13. doi: 10.1186/gb-2004-5-3-r13. [DOI] [PMC free article] [PubMed] [Google Scholar]
- 51.Visone R, Petrocca F, Croce CM. Micro-RNAs in Gastrointestinal and Liver Disease. Gastroenterology. 2008;135:1866–9. doi: 10.1053/j.gastro.2008.10.074. [DOI] [PubMed] [Google Scholar]
- 52.Cheung O, Puri P, Eicken C, Contos MJ, Mirshahi F, Maher JW, Kellum JM, Min H, Luketic VA, Sanyal AJ. Nonalcoholic steatohepatitis is associated with altered hepatic MicroRNA expression. Hepatology. 2008;48:1810–20. doi: 10.1002/hep.22569. [DOI] [PMC free article] [PubMed] [Google Scholar]