Figure 3.


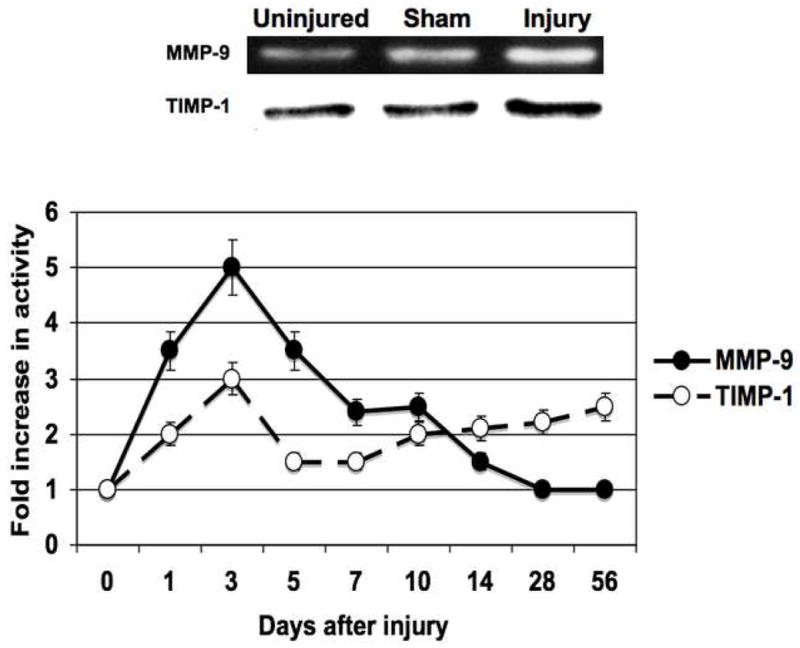
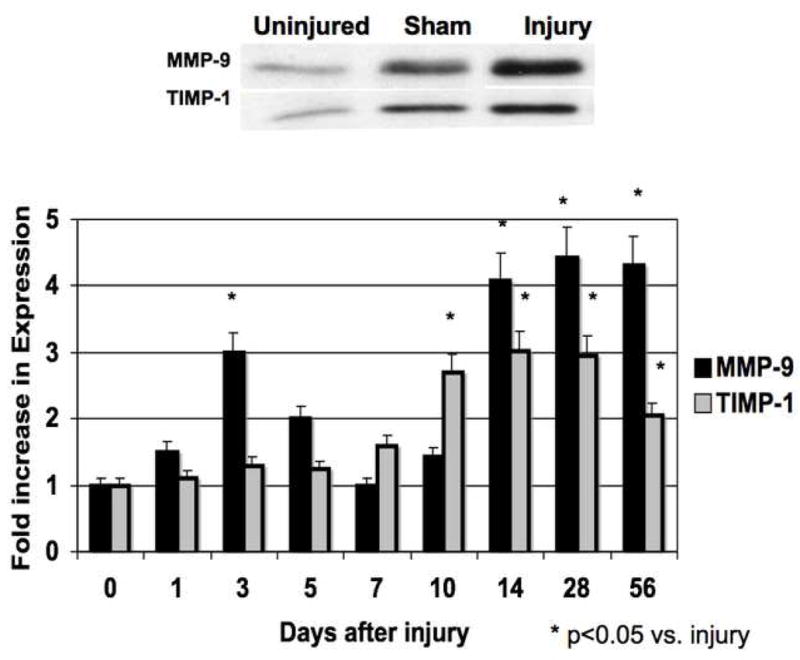
The activity (A) and expression (B) of MMP-9/TIMP-1 in the wire inured femoral vessels over time. Top panel (A) shows a representative zymograms for MMP-9/TIMP-1 at day 7. Top panel (B) shows a representative western blots for MMP-9/TIMP-1 at day 14. Bottom panels show the quantification of the activity or expression data for the injured vessels. Values are the mean± s.e.m. (n=6 per time point). Statistical differences between groups were tested with a Kruskal-Wallis non-parametric test with post hoc Dunn’s multiple comparison correction, where appropriate.
