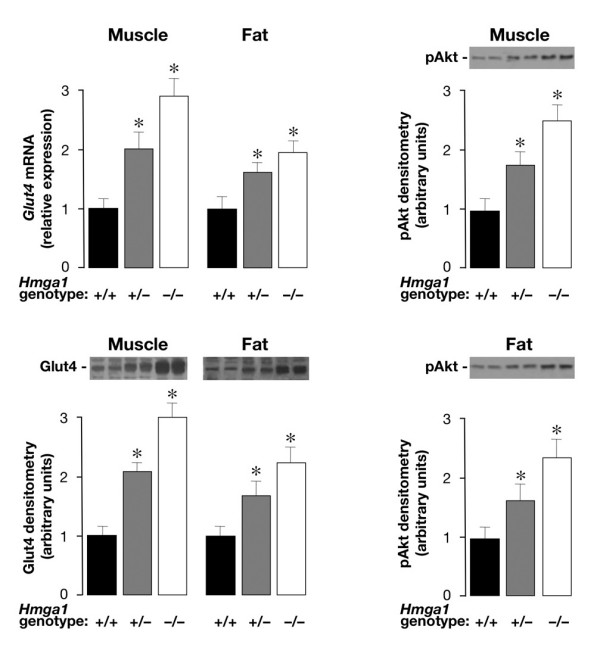
Figure 7.

Glut4 and pAkt expression in wild-type and Hmga1-deficient mice. Glut4 mRNA (upper left) and protein content (lower left) in muscle and fat parallel pAkt protein abundance in skeletal muscle (upper right) and adipose tissue (lower right) from control and Hmga1-deficient mice. Representative Western blots of Glut4 and pAkt proteins are shown, together with the densitometric analyses of six to eight independent blots. Black bars, Hmga1+/+, n = 8; gray bars, Hmga1+/-, n = 6; white bars, Hmga1-/-, n = 6. *P < 0.05 versus Hmga1+/+.
