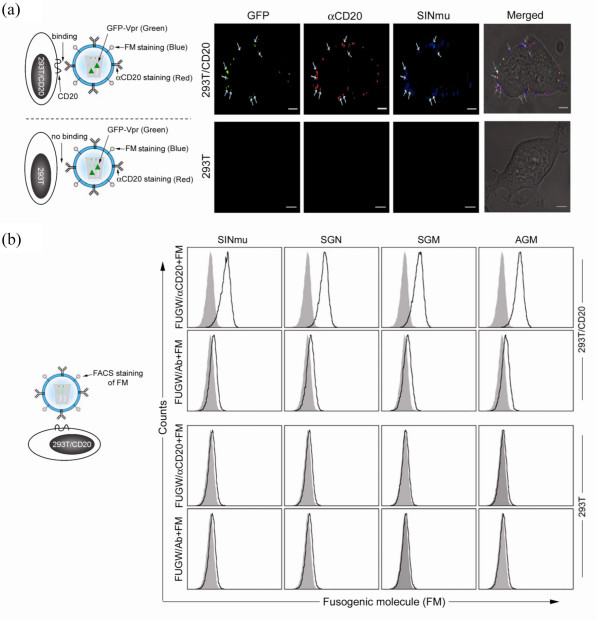
Figure 3.
Co-expression of αCD20 and a FM on the viral vector surface. (a, left) Schematic diagrams to illustrate the interaction between αCD20 on the vector surface and CD20 on the cell surface, and the immuno-fluorescent staining scheme. (a, right) Acquired confocal images of labeled viral vector binding to cells. (b) FACS analysis of 293T or 293T/CD20 cells incubated with FUGW/αCD20+FM or FUGW/Ab+FM. The binding of virus to 293T/CD20 cells was detected by FACS staining with antibody against the FM. Solid line, analysis on cells incubated with indicated viral vectors; shaded area (control), analysis on cells without incubation with vectors.

