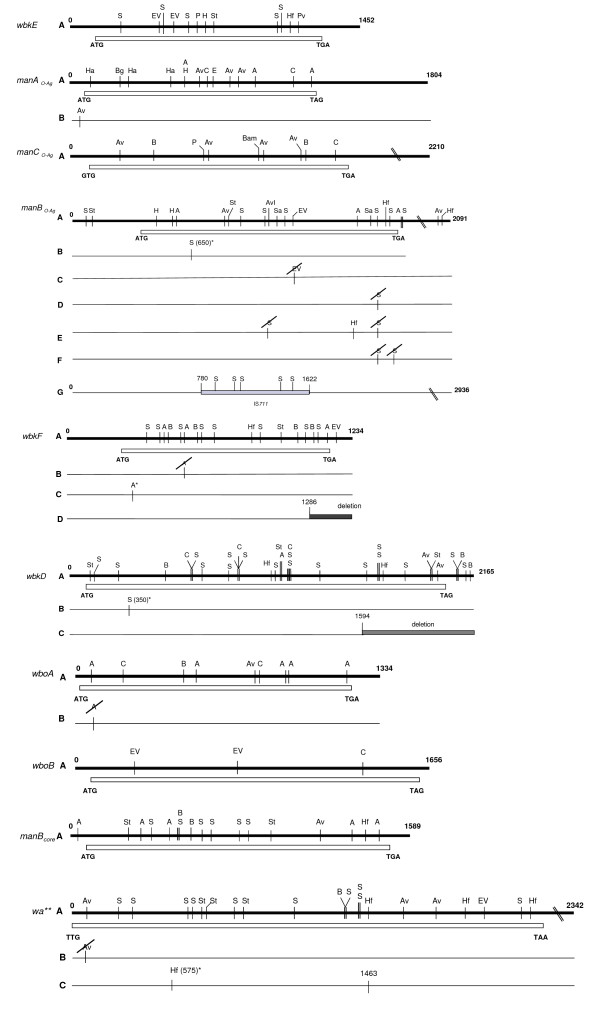
Figure 2.
Restriction maps of the core- and O-polysaccharide genes with the restriction enzymes used. For each gene, restriction map A corresponds to that deduced from the nucleotide sequence of B. melitensis 16 M. Only differences compared to the nucleotide sequences of B. melitensis 16 M are indicated in restriction maps B, C, D, E, F and G. The restriction patterns A, B, C, D, E, F and G are further indicated in Table 1 for each gene and for each Brucella strain studied. Additional sites and their most probable location according to restriction patterns are indicated by the restriction name (e.g. Hf) and by the position name and an asterisk.

