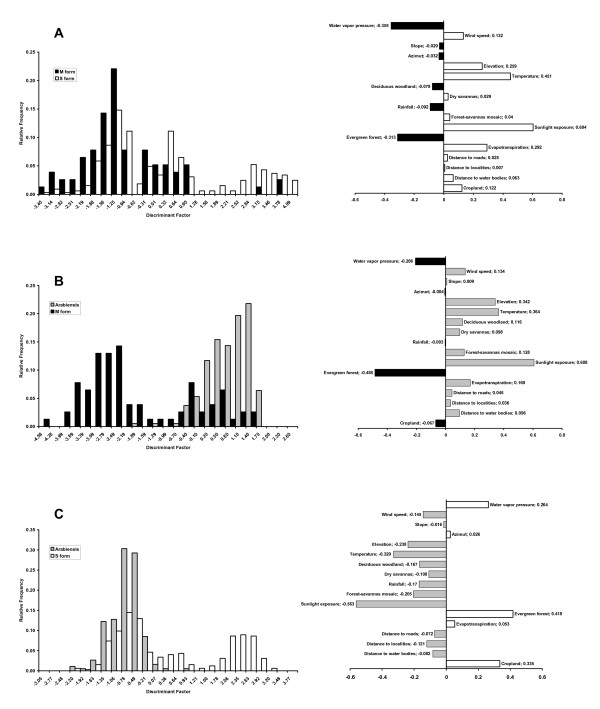
Figure 4.
Ecological niche overlap along the discriminant factor. Ecological niche overlap between An. gambiae M and S forms (A), M and An. arabiensis (B) and S and An. arabiensis (C). Left, frequency plot along the discriminant factor showing niche breadth and overlap; Right, schematic representation of the discriminant function showing the contribution of the different eco-geographical variables (EGVs, see Methods) to the discriminant factor.

