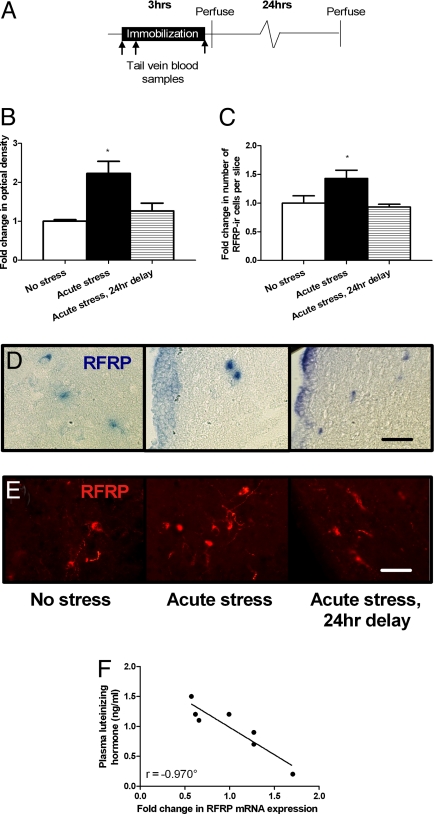
Fig. 1.
Acute stress effects on RFRP expression. (A) Experimental time line. (B) Stressed rats showed higher RFRP mRNA expression levels (mean ± SEM) than controls immediately after stress (P = 0.002). (C) Stressed rats showed more RFRP peptide positive cells (mean ± SEM) than controls immediately after stress (P = 0.006). (D) Representative images of RFRP mRNA positive cells in the DMH. (E) Representative images of RFRP-ir cells in the DMH. (F) There was a significant negative correlation between fold change in RFRP mRNA and plasma-luteinizing hormone (r = −0.920, P = 0.003). *P < 0.05 compared with no-stress and acute stress, 24-hour-delay controls combined. °P < 0.05 correlation. Scale bar, 40 μM.

