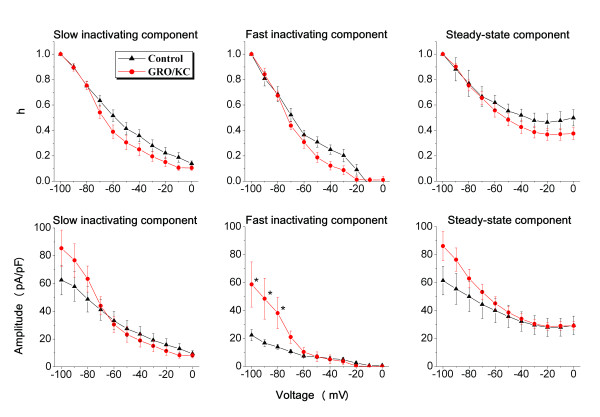
Figure 5.
Effects of GRO/KC on the fitted two exponential fits to steady state inactivation data. The falling phase of currents during a pulse to +20 mV after a prepulse to the indicated voltage was fit with the sum of two exponentials plus a steady state value. At this test voltage, most cells show two kinetically distinct components of the transient K current. The values of the amplitudes of each component are normalized to the value at -100 mV (top): left, slow inactivating; middle, fast inactivating; right, steady state component. The bottom panels show the corresponding absolute values of the fitted amplitudes. * Individual voltages at which the differences between GRO/KC and control values were significant. Data in this and previous figures are from 5 cultures; N = 12 GRO/KC cells and 11 control cells.

