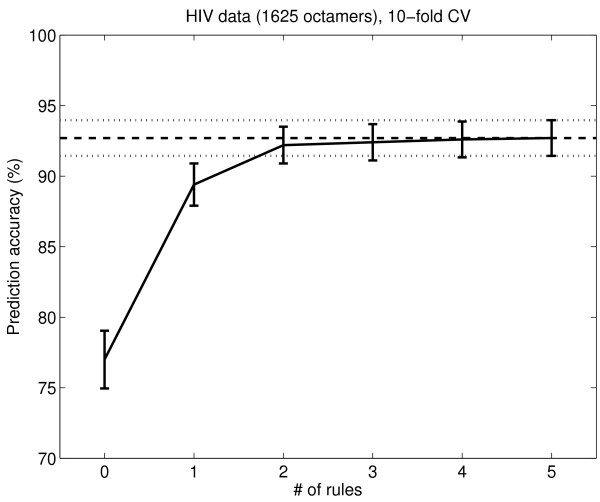
Figure 2.
OSRE rules' performance on the HIV-1 PR 1625 data set. The performance of the OSRE rules on the 1625 peptide HIV-1 PR data. The x-axis shows the number of rules used in the prediction. The y-axis shows the CV accuracy (%). The error bars are 1.96 times the binomial standard deviations. The horizontal lines show the accuracy when all rules (even more than 5) are used. The accuracy for zero rules is the default accuracy, when all peptides are classified as the majority class.

