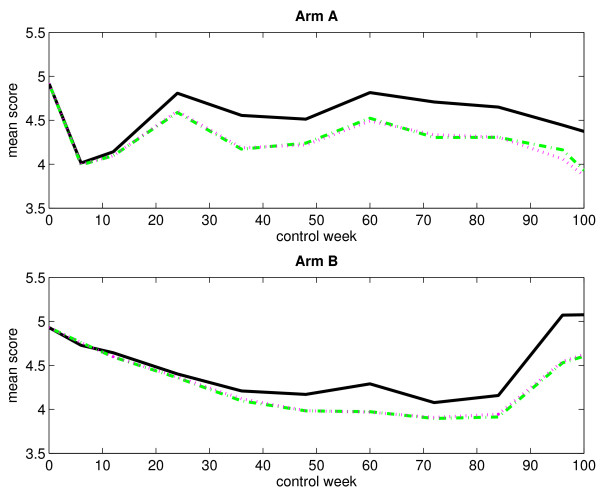
Figure 2.
Observed and estimated mean scores for a mortal cohort (without single imputation). The figure displays the observed and estimated mean scores for arm A (upper panel) and arm B (lower panel) when considering a mortal cohort. Single imputation has not been applied. The black solid-line curve corresponds to the arithmetic average of the observed score values, the magenta dotted-line curve corresponds to the LI method, and the green dash-dotted-line curve corresponds to the LI method when considering an immortal cohort (for comparison).

