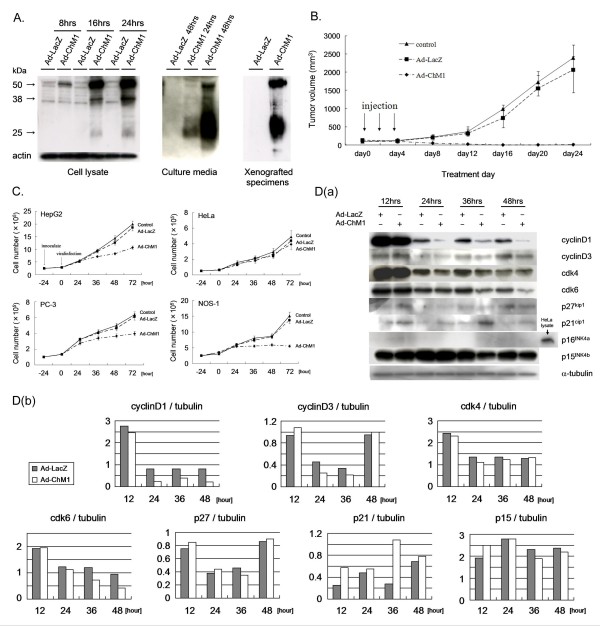
Figure 2.
The effect of ChM1 on growth of tumor cells cultured on plates. A. Western blot analysis of the expression of transfected ChM1 in cells and xenografted tumors. ChM1 protein was detected in cells 8 hrs after transfection and increased in a time-dependent manner (left panel). The amount of protein secreted into the medium also increased in a time-dependent manner (middle panel). The protein was detected in xenografted tumor specimens harvested 48 hrs after transfection (right panel). The diffuse 25 kDa band corresponds to the monomer and glycosylated forms of ChM1 and the bands at approximately 38 kDa and 50 kDa correspond to the precursor and dimerized forms of ChM1, respectively. B. The effect of ChM1 on the growth of implanted HepG2 cells in athymic mice. Adenoviral gene therapy was initiated when tumors attained a volume of 150 mm3. ChM1 caused a complete suppression of tumor growth. Each point and bar represents the mean and SD (n = 6). C. ChM1 growth suppression of tumor cells cultured on plates. The inhibitory effect of ChM1 was observed 36 hrs after transfection in HepG2, PC-3 and NOS-1, but not in HeLa cells (n = 4). Each point and bar represents the mean and SD (n = 4). D. ChM1 alters the levels of cell cycle-related proteins in HepG2 cells cultured on plates. (a) Western blot analysis demonstrated that ChM1 altered the levels of some of cell cycle-related proteins. (b) Corresponding densitometry analysis showed that ChM1 significantly decreased from 24 hours, while cdk6 protein decreased from 36 hours, after adenoviral infection. The level of cyclin D3 protein was significantly decreased by ChM1 at 24 hours and 36 hours. In contrast, ChM1 significantly increased the level of p21cip1, a cdk inhibitor, at 12 hours and 36 hours.

