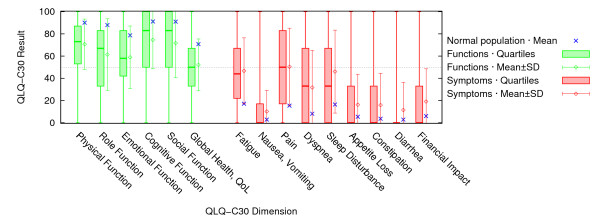
Figure 2.
Results of the initial QLQ-C30 assessment (n = 398 patients). For all QLQ-C30 scales, boxplots – including median and interquartile range (box) as well as maximum and minimum (whiskers) – are displayed. Means ± standard deviations from our sample are additionally indicated to facilitate comparisons to mean reference values (asterisks) from the general population [24]. The dotted line represents the "simplified threshold value" of 50; higher values indicate better function (left); lower values indicate lower symptoms (right).

